Equinix: the neutral ground between every cloud
8 minute read | Apr 25, 2026 | Reviewed by Howie Mann
Equinix finds land, secures power, builds data centres, and leases the space and electrical capacity inside them. The company operates 280 data centres across 77 cities in 36 countries. Revenue splits into colocation (70%), monthly rent for rack space and power on one-to-five-year contracts, and interconnection (18%), physical cables connecting one tenant’s equipment to another tenant’s equipment inside the same building. Interconnection carries a higher margin, and the density of connections is the lock-in: tenants stay because the companies they need to reach are already there. Ninety-five per cent of revenue recurs monthly. No single customer exceeds 3% of the total.
| Line item (USD M) | FY2022 | FY2025 | 3Y Change ($) | % of FY2025 Revenue |
|---|---|---|---|---|
| Colocation | 5,083 | 6,475 | +1,392 | 70% |
| Interconnection | 1,268 | 1,655 | +387 | 18% |
| Managed infrastructure & other | 520 | 609 | +89 | 7% |
| Non-recurring | 392 | 478 | +86 | 5% |
| Total | 7,263 | 9,217 | +1,954 | 100% |
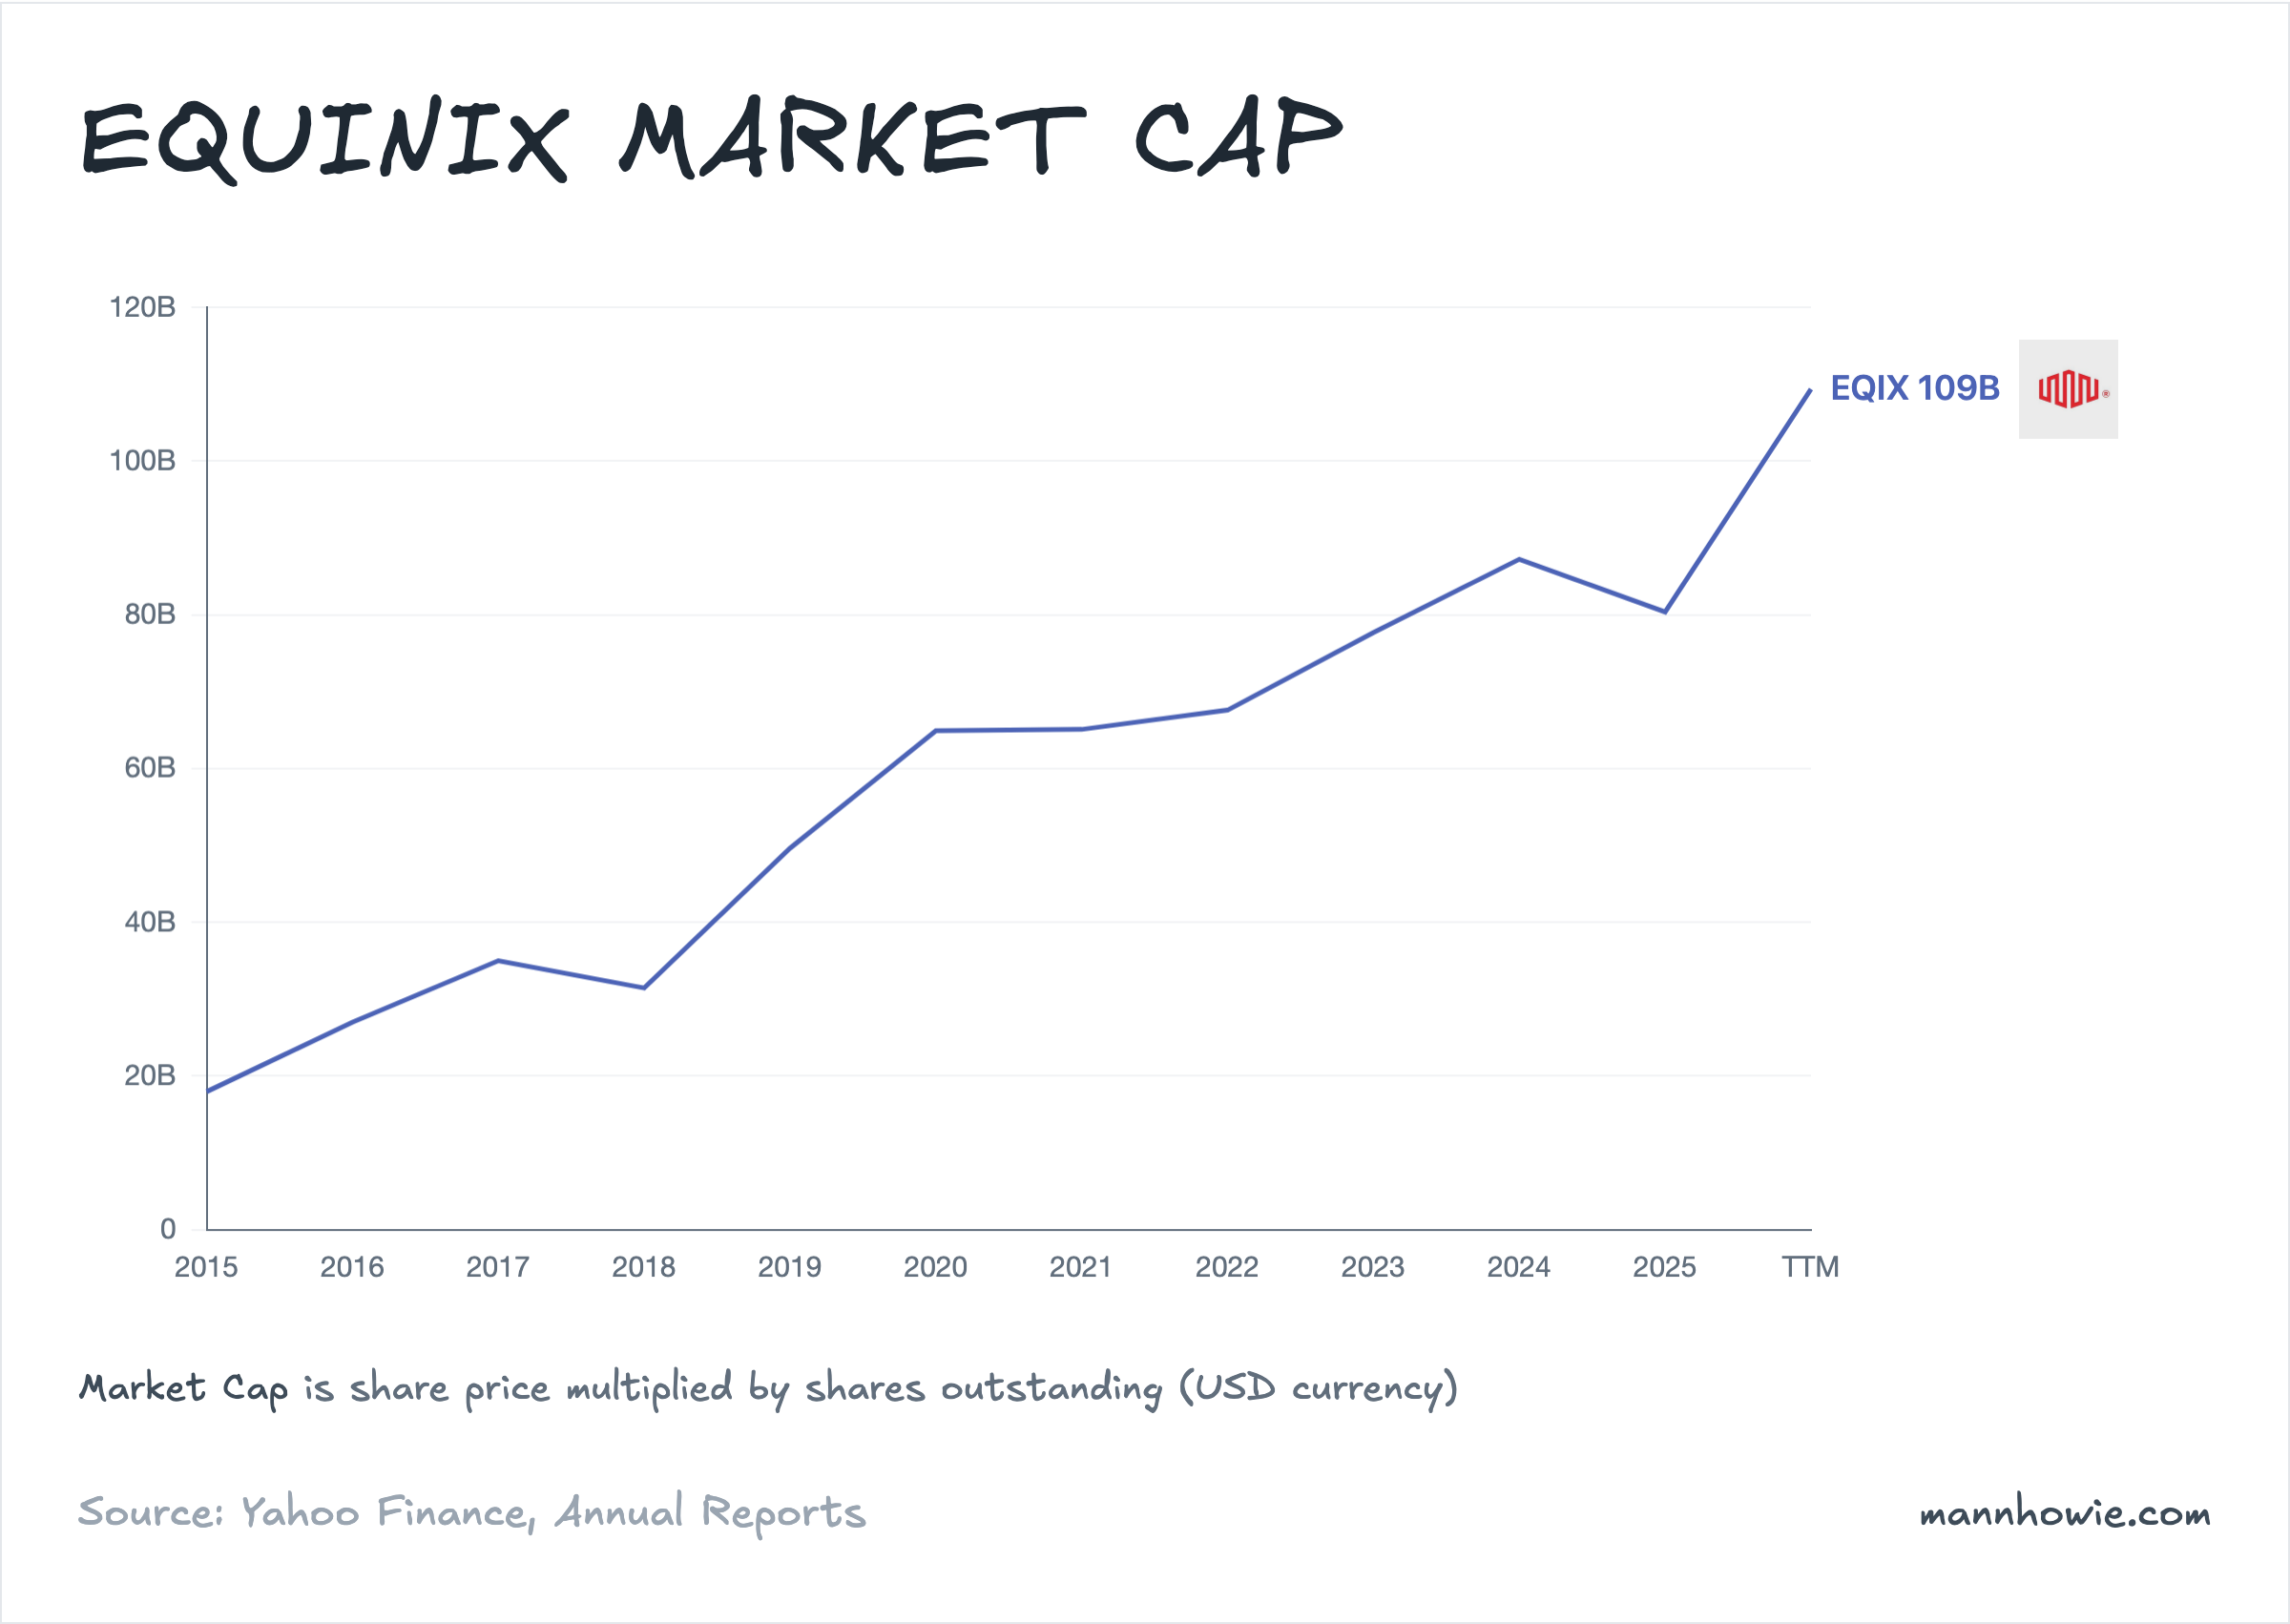
Equinix, Digital Realty and NTT are the three dominant neutral colocation operators, together holding roughly a quarter of the worldwide market. Digital Realty runs ~3,000 MW of total IT capacity across 300+ facilities and NTT supports over 1,300 MW, but both skew toward wholesale, leasing large blocks of power to single tenants. Equinix does not disclose total deployed megawatts. Converting its 299,300 billed cabinets at an estimated 4.5 kW average density, plus its pro-rata share of leased xScale capacity (20 to 25% equity interest), yields roughly 1,400 MW of billed load: less than half of Digital Realty’s footprint. The gap does not show up in revenue. Equinix generates roughly $6.5M per billed MW, nearly three times Digital Realty’s $2.4M. Two drivers: retail colocation commands higher per-kW pricing than wholesale, and interconnection (18% of Equinix revenue versus ~8% at Digital Realty) layers high-margin fees on top of every rack. At year-end Equinix had 507,000 cross-connects, more than double the nearest competitor.
| Metric (FY2025) | Equinix | Digital Realty | NTT |
|---|---|---|---|
| Total revenue (USD B) | 9.2 | 6.1 | ~2.4 |
| Interconnection % of revenue | 18% | ~8% | ~5% |
| Estimated billed MW | ~1,400 | ~2,500 | ~1,000 |
| Revenue per billed MW (USD M) | ~6.5 | ~2.4 | ~2.4 |
Why hyperscalers lease from Equinix. A hyperscaler’s own data centre is a rural campus for bulk compute: cheap land, abundant power, no outside tenants. An Equinix facility sits in the metropolitan core where the networks meet. Hyperscalers are not buying space; they are buying access. When a bank wants a private cable into AWS, that cable terminates at an Equinix facility via AWS Direct Connect. Azure ExpressRoute and Google Cloud Interconnect work the same way, with over 220 cloud on-ramps across the six largest providers. ISP peering happens at these hubs too, at lower cost than running fibre to a rural campus. AI inference, where a trained model serves predictions in real time, is sensitive to physical distance, which puts Equinix’s metro locations closer to end users than a hyperscaler campus can be. And for enterprises running legacy servers alongside cloud workloads, a cross-connect inside an Equinix building links their hardware directly to the hyperscaler’s equipment, making cloud migration a physical patch cable rather than a network redesign.
AI demand is filling buildings faster than Equinix can build them
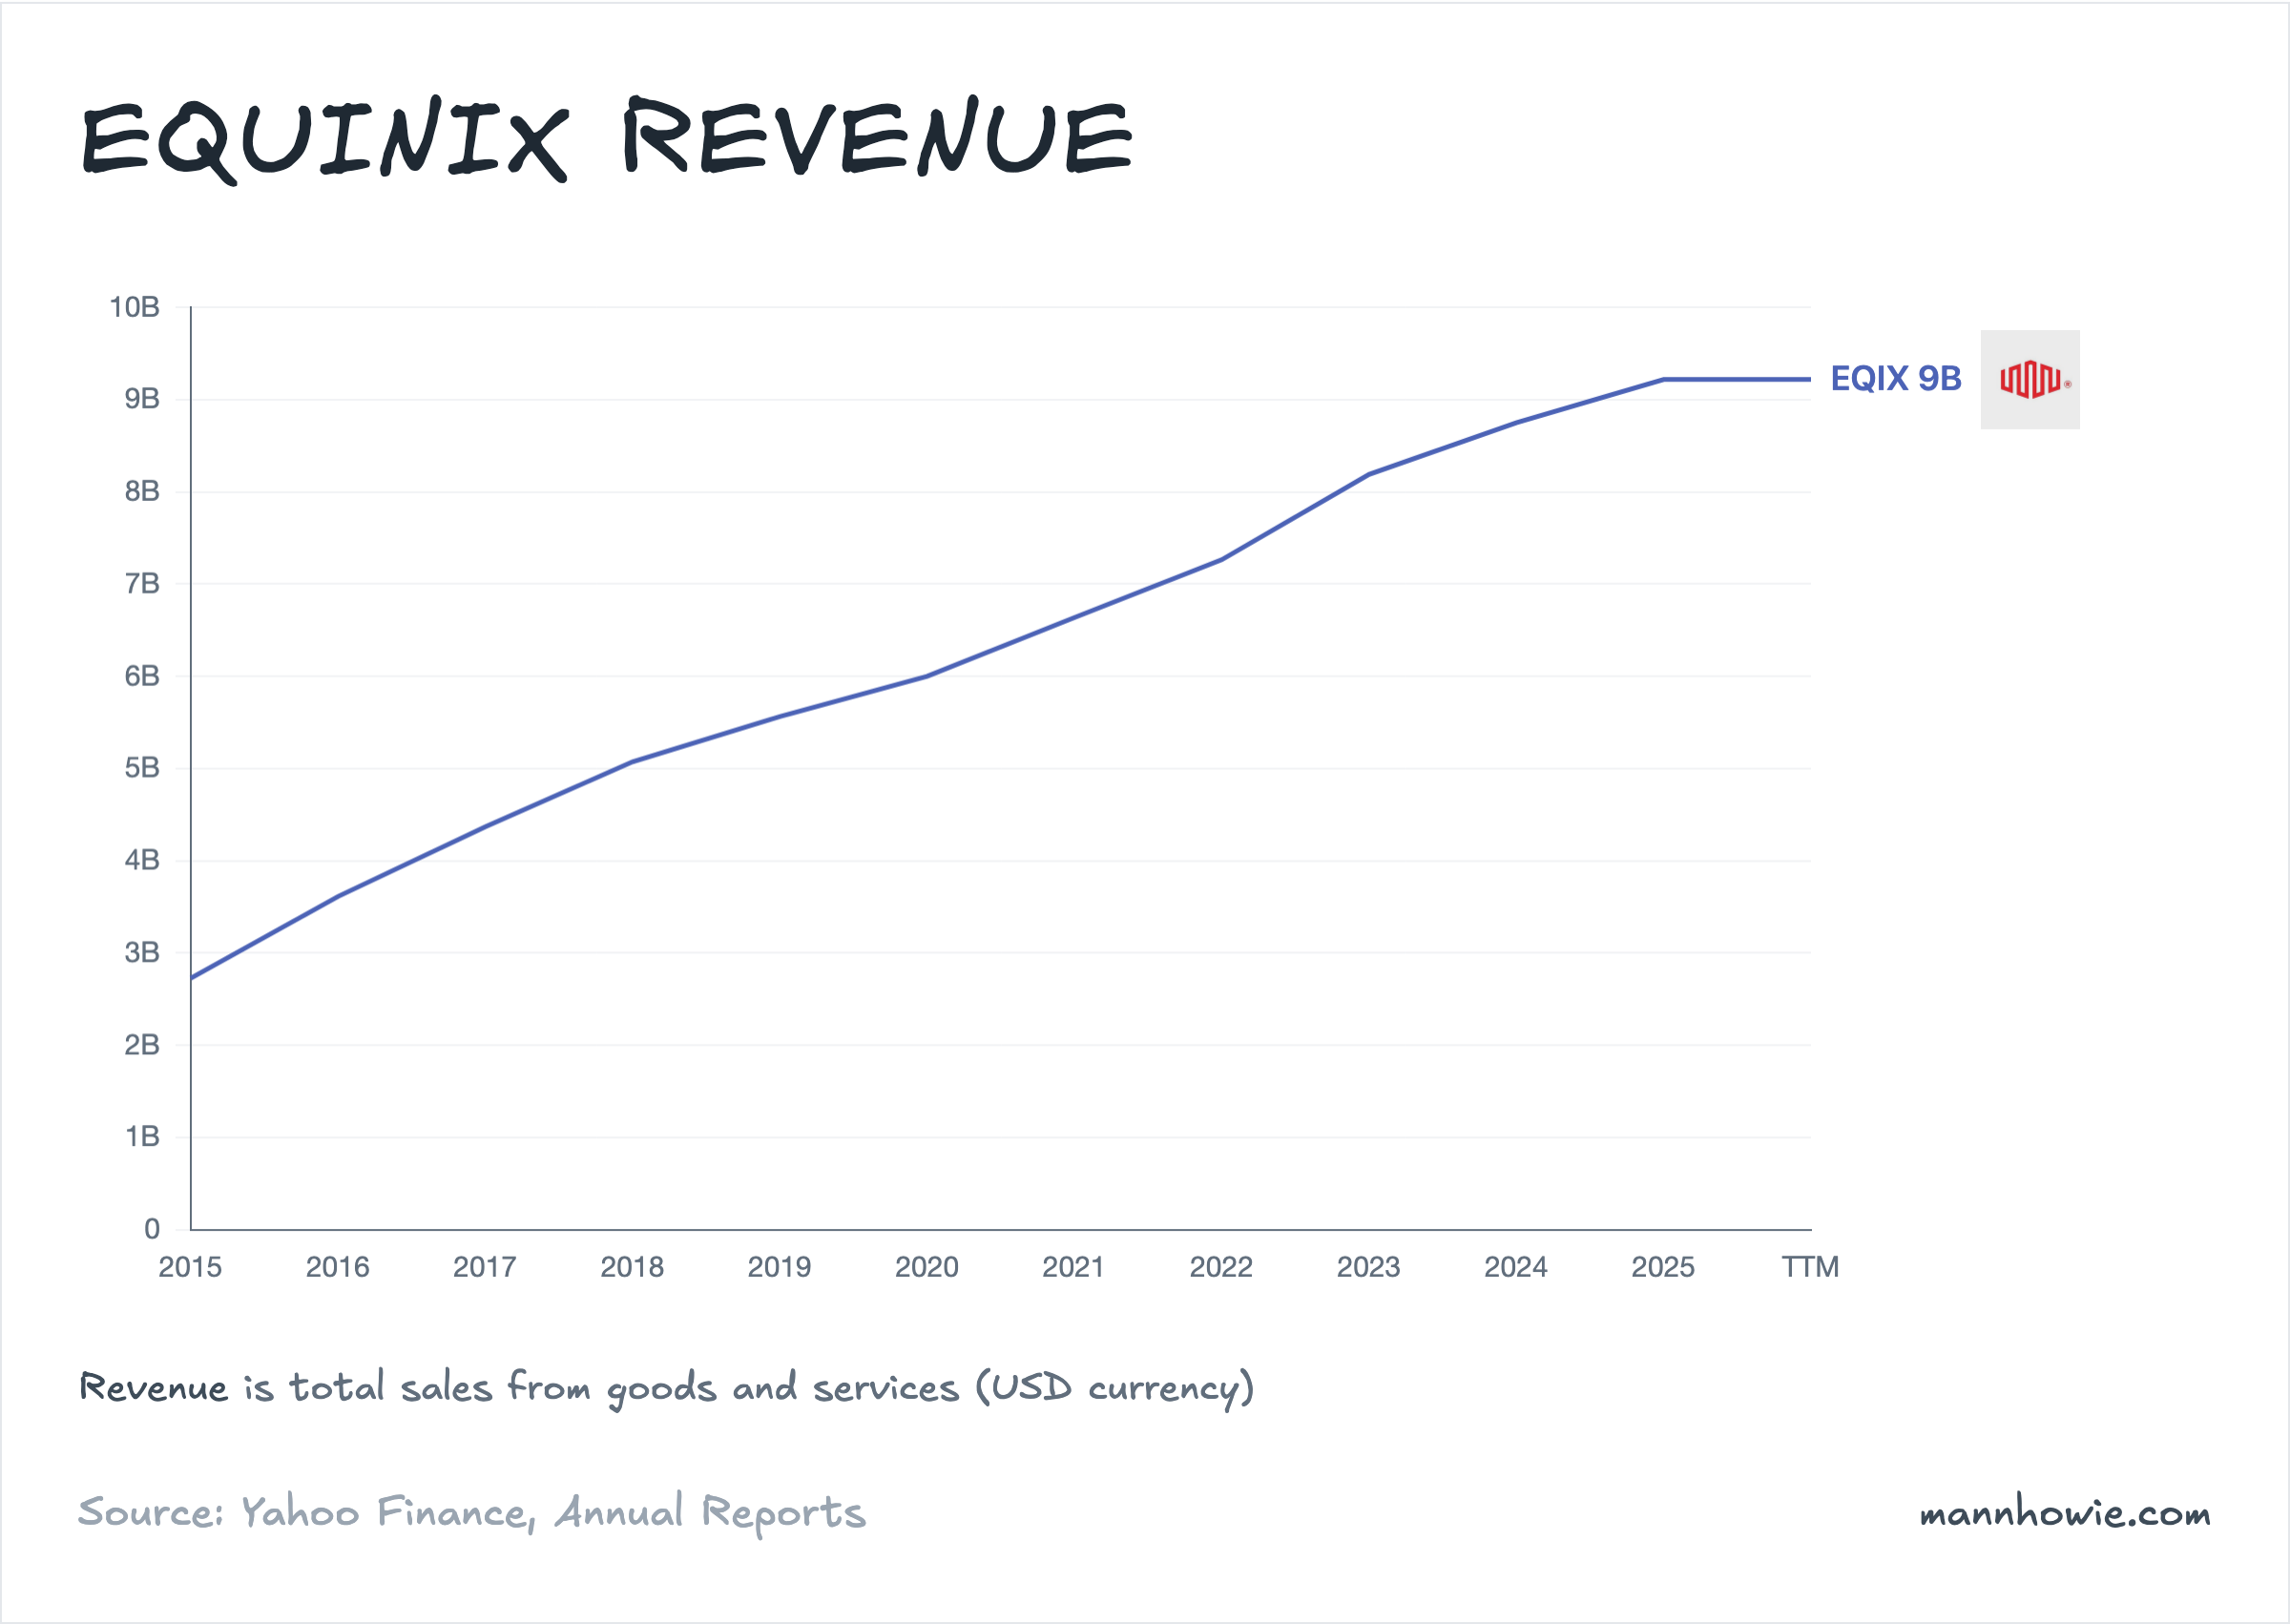
Revenue reached $9.2B in FY2025, up $2B in three years. The five largest cloud companies spent $379B on capex in FY2025, more than double the $155B in FY2022.
| Hyperscaler capex (USD M) | FY2022 | FY2025 | 3Y Change ($) |
|---|---|---|---|
| Amazon | 63,645 | 131,819 | +68,174 |
| Alphabet | 31,485 | 91,447 | +59,962 |
| Meta | 31,186 | 69,691 | +38,505 |
| Microsoft | 23,886 | 64,551 | +40,665 |
| Oracle | 4,511 | 21,215 | +16,704 |
| Total | 154,713 | 378,723 | +224,010 |
Every GPU cluster needs a data centre, a cross-connect to a network, and a metro near the enterprise it serves. Annualised gross bookings reached $1.6B for the year, up 27%, with 60% of the largest Q4 deals driven by AI workloads.
“60% of our largest deals were driven by AI workloads. Nearly half of them were deployed by non-cloud companies — retail, e-commerce, manufacturing, financial services and content.”
— Adaire Fox-Martin, CEO, Equinix Q4 FY2025 earnings call
Supply, not demand, is the constraint. Management committed to doubling capacity by 2029 under Build Bolder. Powered land under control reached three gigawatts in 2025, up roughly 50% in the second half alone. Fifty-two development projects were underway at year-end across 35 metros.
The REIT structure constrains how Equinix funds the build
Equinix elected REIT status in 2015. The trade-off: no federal corporate income tax on distributed income, but the company must pay out at least 90% of its REIT taxable income as dividends every year. The quarterly dividend is $4.69 per share, roughly $1.9B a year. That payout is not optional. If Equinix misses it, it loses the REIT status and owes full corporate tax, retroactively.
The consequence: Equinix cannot retain earnings to fund growth. Every dollar of expansion capital that operating cash flow does not cover must come from outside.
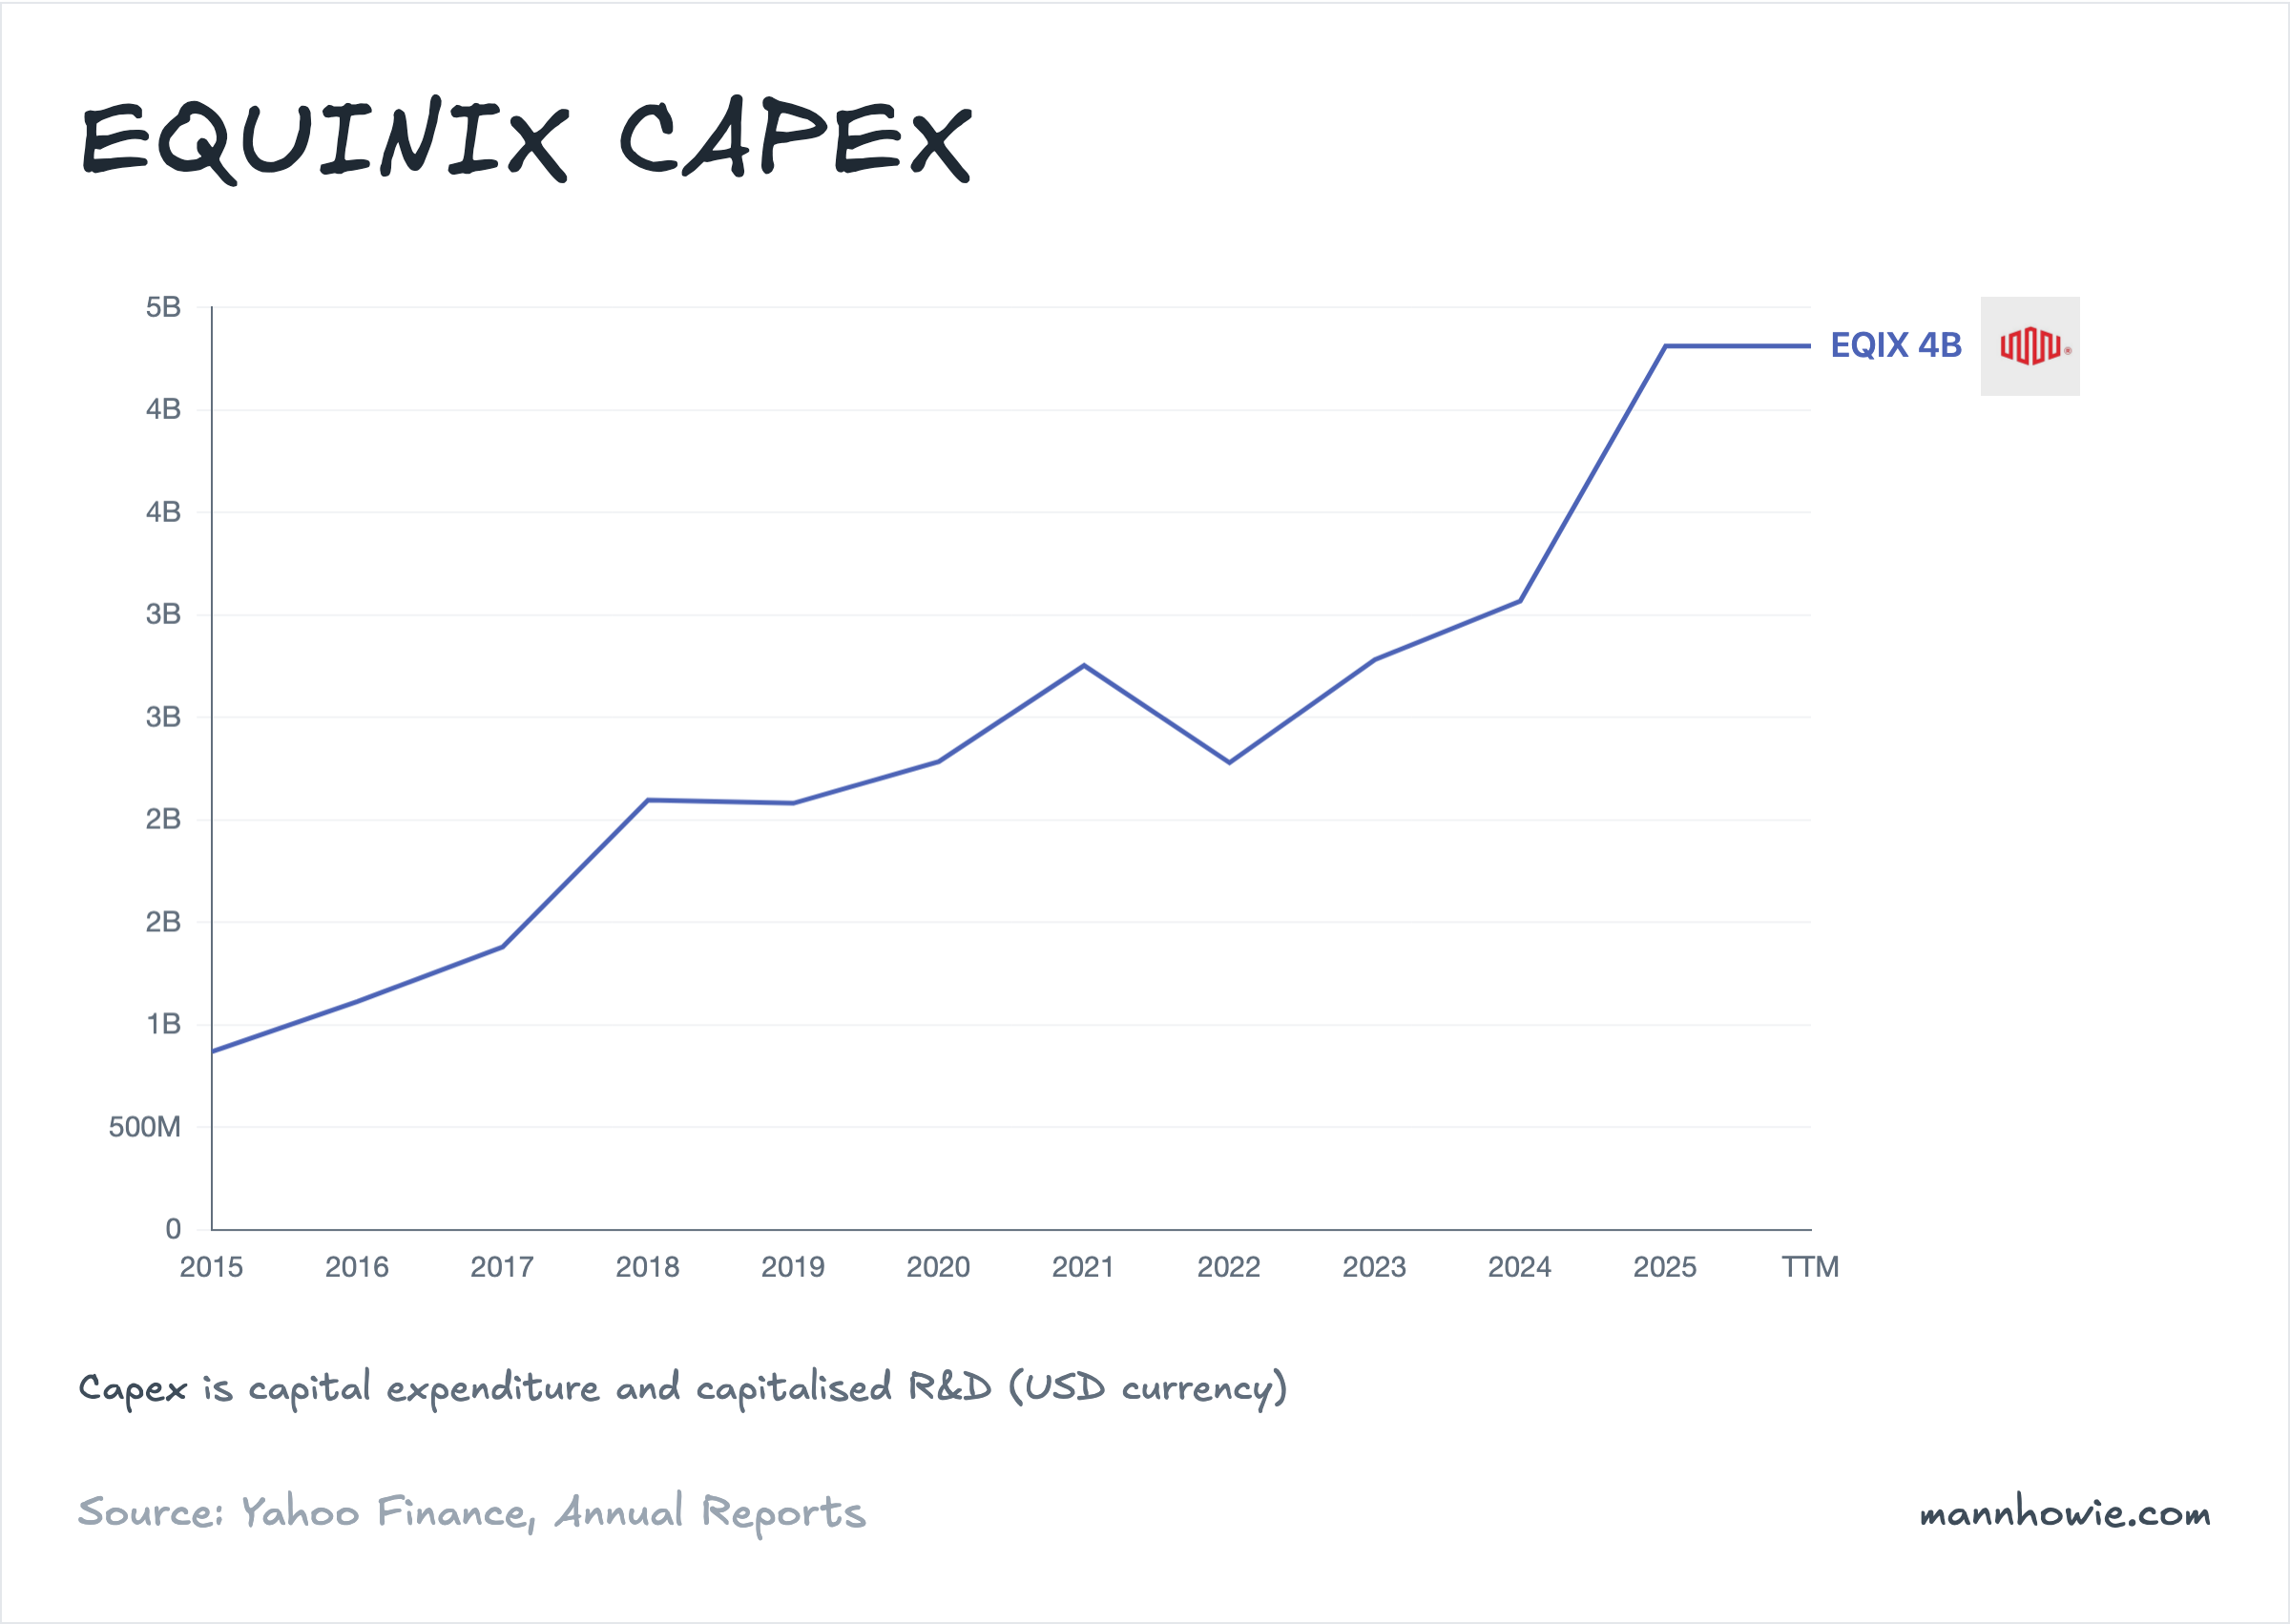
In FY2025, operating cash flow was $3.9B. Capex was $4.3B. Before dividends, the company was $400M short. After the mandatory $1.9B distribution, free cash flow was minus $898M. The gap was filled by debt. Senior notes outstanding rose from $14.7B to $18.4B in one year, $4.4B of new issuance.
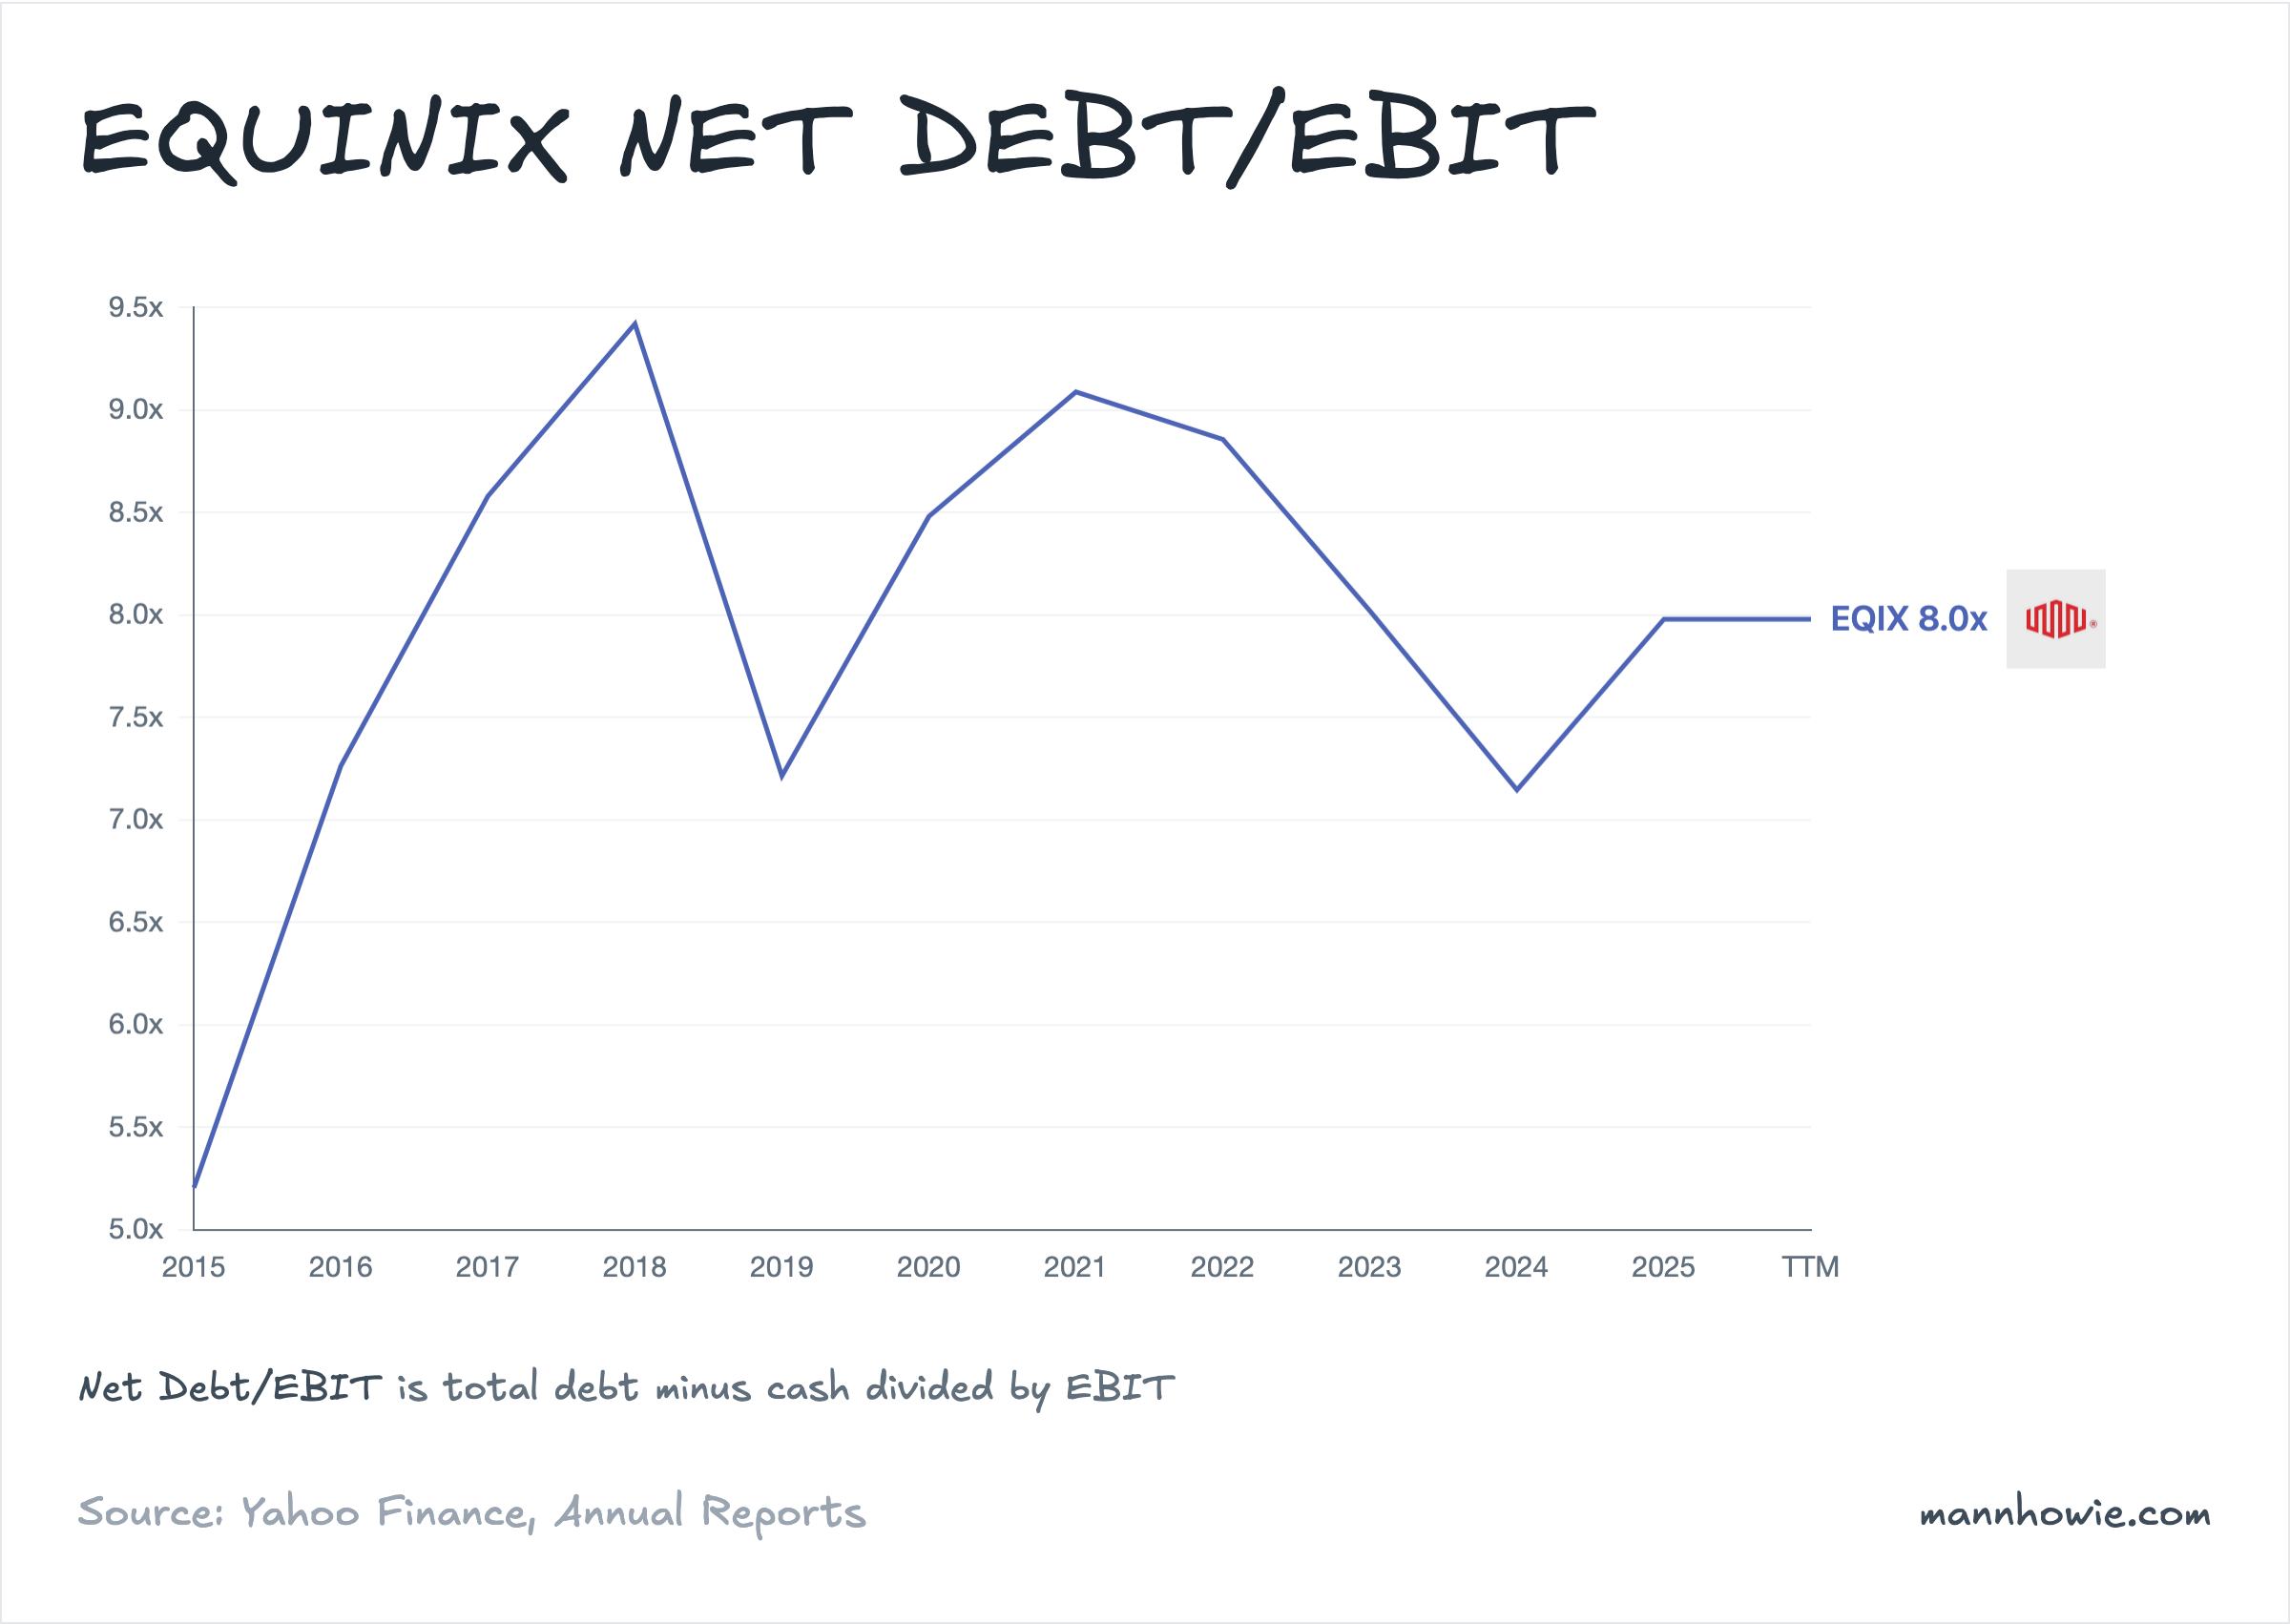
Net leverage moved from 3.5x to 3.8x adjusted EBITDA during 2025. Management’s ceiling is 4.5x, leaving roughly 0.7 turns of headroom. Interest expense climbed from $402M in FY2023 to $527M in FY2025 and will keep rising. Recent issuance has been placed in lower-rate foreign markets: Q4 2025 notes were priced at 3.2%, against a US comparable closer to 5%.
Equity has historically been a significant funding source: $2.5B in 2017, $1.7B in 2019, $2.0B in 2020. But recent issuance slowed to $99M in early 2025, with $1.2B of authorised capacity remaining.
“Our balance sheet is a strategic differentiator. We continue to remain comfortable raising our debt levels up to 4.5x in support of this growth while maintaining our investment-grade rating.”
— Keith Taylor, CFO, Equinix Q3 FY2025 earnings call
Joint ventures, asset returns and the path forward
Management’s primary answer is the xScale joint venture. Equinix builds large-format hyperscale data centres and sells them into JVs backed by sovereign-wealth partners, principally GIC. Equinix keeps a 20–25% equity stake and collects fees. The construction debt stays off the balance sheet. The latest vehicle, AMER 3, is sized for ~$15B of deployment across major US metros. Close to one gigawatt of the three-gigawatt land bank is earmarked for xScale builds.
The second part is the economics of existing assets. Equinix’s 187 stabilised data centres ran at 82% utilisation and generated a 27% cash-on-cash return on gross PP&E in FY2025. New builds are underwritten at ~25% stabilised yield, repaying gross capex inside four years once filled. Adjusted EBITDA margin was 49% in FY2025 and is guided to 51% in FY2026.
The constraint is time. Power procurement now requires upfront capital to secure load ramps. Supply-chain lead times have pushed the company into prepurchasing equipment. Both push capital out before revenue arrives.
Equinix owns the buildings where cloud providers, carriers and enterprises physically plug into each other. 507,000 connections across 280 data centres, more than double any competitor. AI is driving record demand, but the REIT structure forces $1.9B in annual dividends out the door, so the company cannot keep the cash to fund the build. The gap is filled with debt climbing toward a 4.5x leverage ceiling, and joint ventures with sovereign wealth funds that take the biggest projects off the balance sheet.
Sources
- Equinix 10-K FY2025: Item 1 (business description, revenue model, capacity under construction); Item 2 (IBX portfolio by region); Item 7 (MD&A: revenue, adjusted EBITDA, AFFO, liquidity, debt issuance, ATM programme); REIT distribution requirements (pages 34–37, 51–52).
- Equinix 10-K FY2024, pages F-57 through F-60 (segment revenue and capex FY2022–FY2024).
- Equinix Q3 FY2025 earnings call, October 29, 2025 (3 GW developable land, xScale pipeline, Keith Taylor leverage commentary).
- Equinix Q4 FY2025 earnings call, February 11, 2026 (Q4 bookings $474M, AI workload share 60%, 27% cash-on-cash return, 2026 AFFO guidance, debt issuance at 3.2%).
- Equinix Q4 FY2025 earnings presentation: 299,300 billed cabinets, 392,300 total capacity, 326 MW xScale operational, 507,000 interconnections.
- Digital Realty 10-K FY2025, NTT GDC public filings: capacity and revenue comparisons.
- Microsoft, Alphabet, Amazon, Meta, Oracle 10-K FY2025 filings (capital expenditure FY2022–FY2025).