NEXTDC: scaling Australia's AI infrastructure before the cash arrives
11 minute read | Apr 26, 2026 | Reviewed by Howie Mann
NEXTDC builds and runs carrier-neutral data centres in the Asia-Pacific. It owns the buildings, locks in grid power, fits out the halls, and leases the capacity to cloud providers, enterprises and government. Revenue comes from three lines: colocation (~79%, monthly rent for racks and power), power passthrough (~14%, energy recharged at no margin), and interconnection (~7%, cross-connect fees through the AXON platform). The fiscal year ends 30 June.
NEXTDC is Australia’s largest neutral colocation operator: 17 facilities and 1.8 GW of planned IT power. Sixteen sit in Australian capital cities. KL1 Kuala Lumpur is under construction and TK1 Tokyo has just begun. Asia-Pacific expansion is real but early.
Why neutral colocation exists. A hyperscaler’s own data centre is a rural campus built for bulk compute. A neutral facility sits in the metro core where networks meet. Hyperscalers lease space inside these buildings to buy access. A bank’s private link into AWS terminates inside a neutral building via AWS Direct Connect. Azure ExpressRoute and Google Cloud Interconnect work the same way. ISPs peer at these hubs. AI inference workloads sit closer to end users than a rural campus allows. Enterprises keep legacy hardware on the same floor as the cloud they are migrating to.
| Operator | Region | IT capacity | FY25 revenue | Market cap (USD) |
|---|---|---|---|---|
| Equinix | Global, 36 countries | ~1,400 MW billed, 3 GW land bank | USD 9.2B | ~109B |
| Digital Realty | Global, wholesale-heavy | ~3,000 MW operational | USD 6.1B | ~70B |
| NTT GDC | Global, Japan-anchored | ~1,300 MW | USD ~2.4B | n/a (parent) |
| AirTrunk | APAC + Middle East, wholesale hyperscale | ~800 MW committed, 2.6 GW total deployable | n/d (private) | ~16B (Sept 2024 EV) |
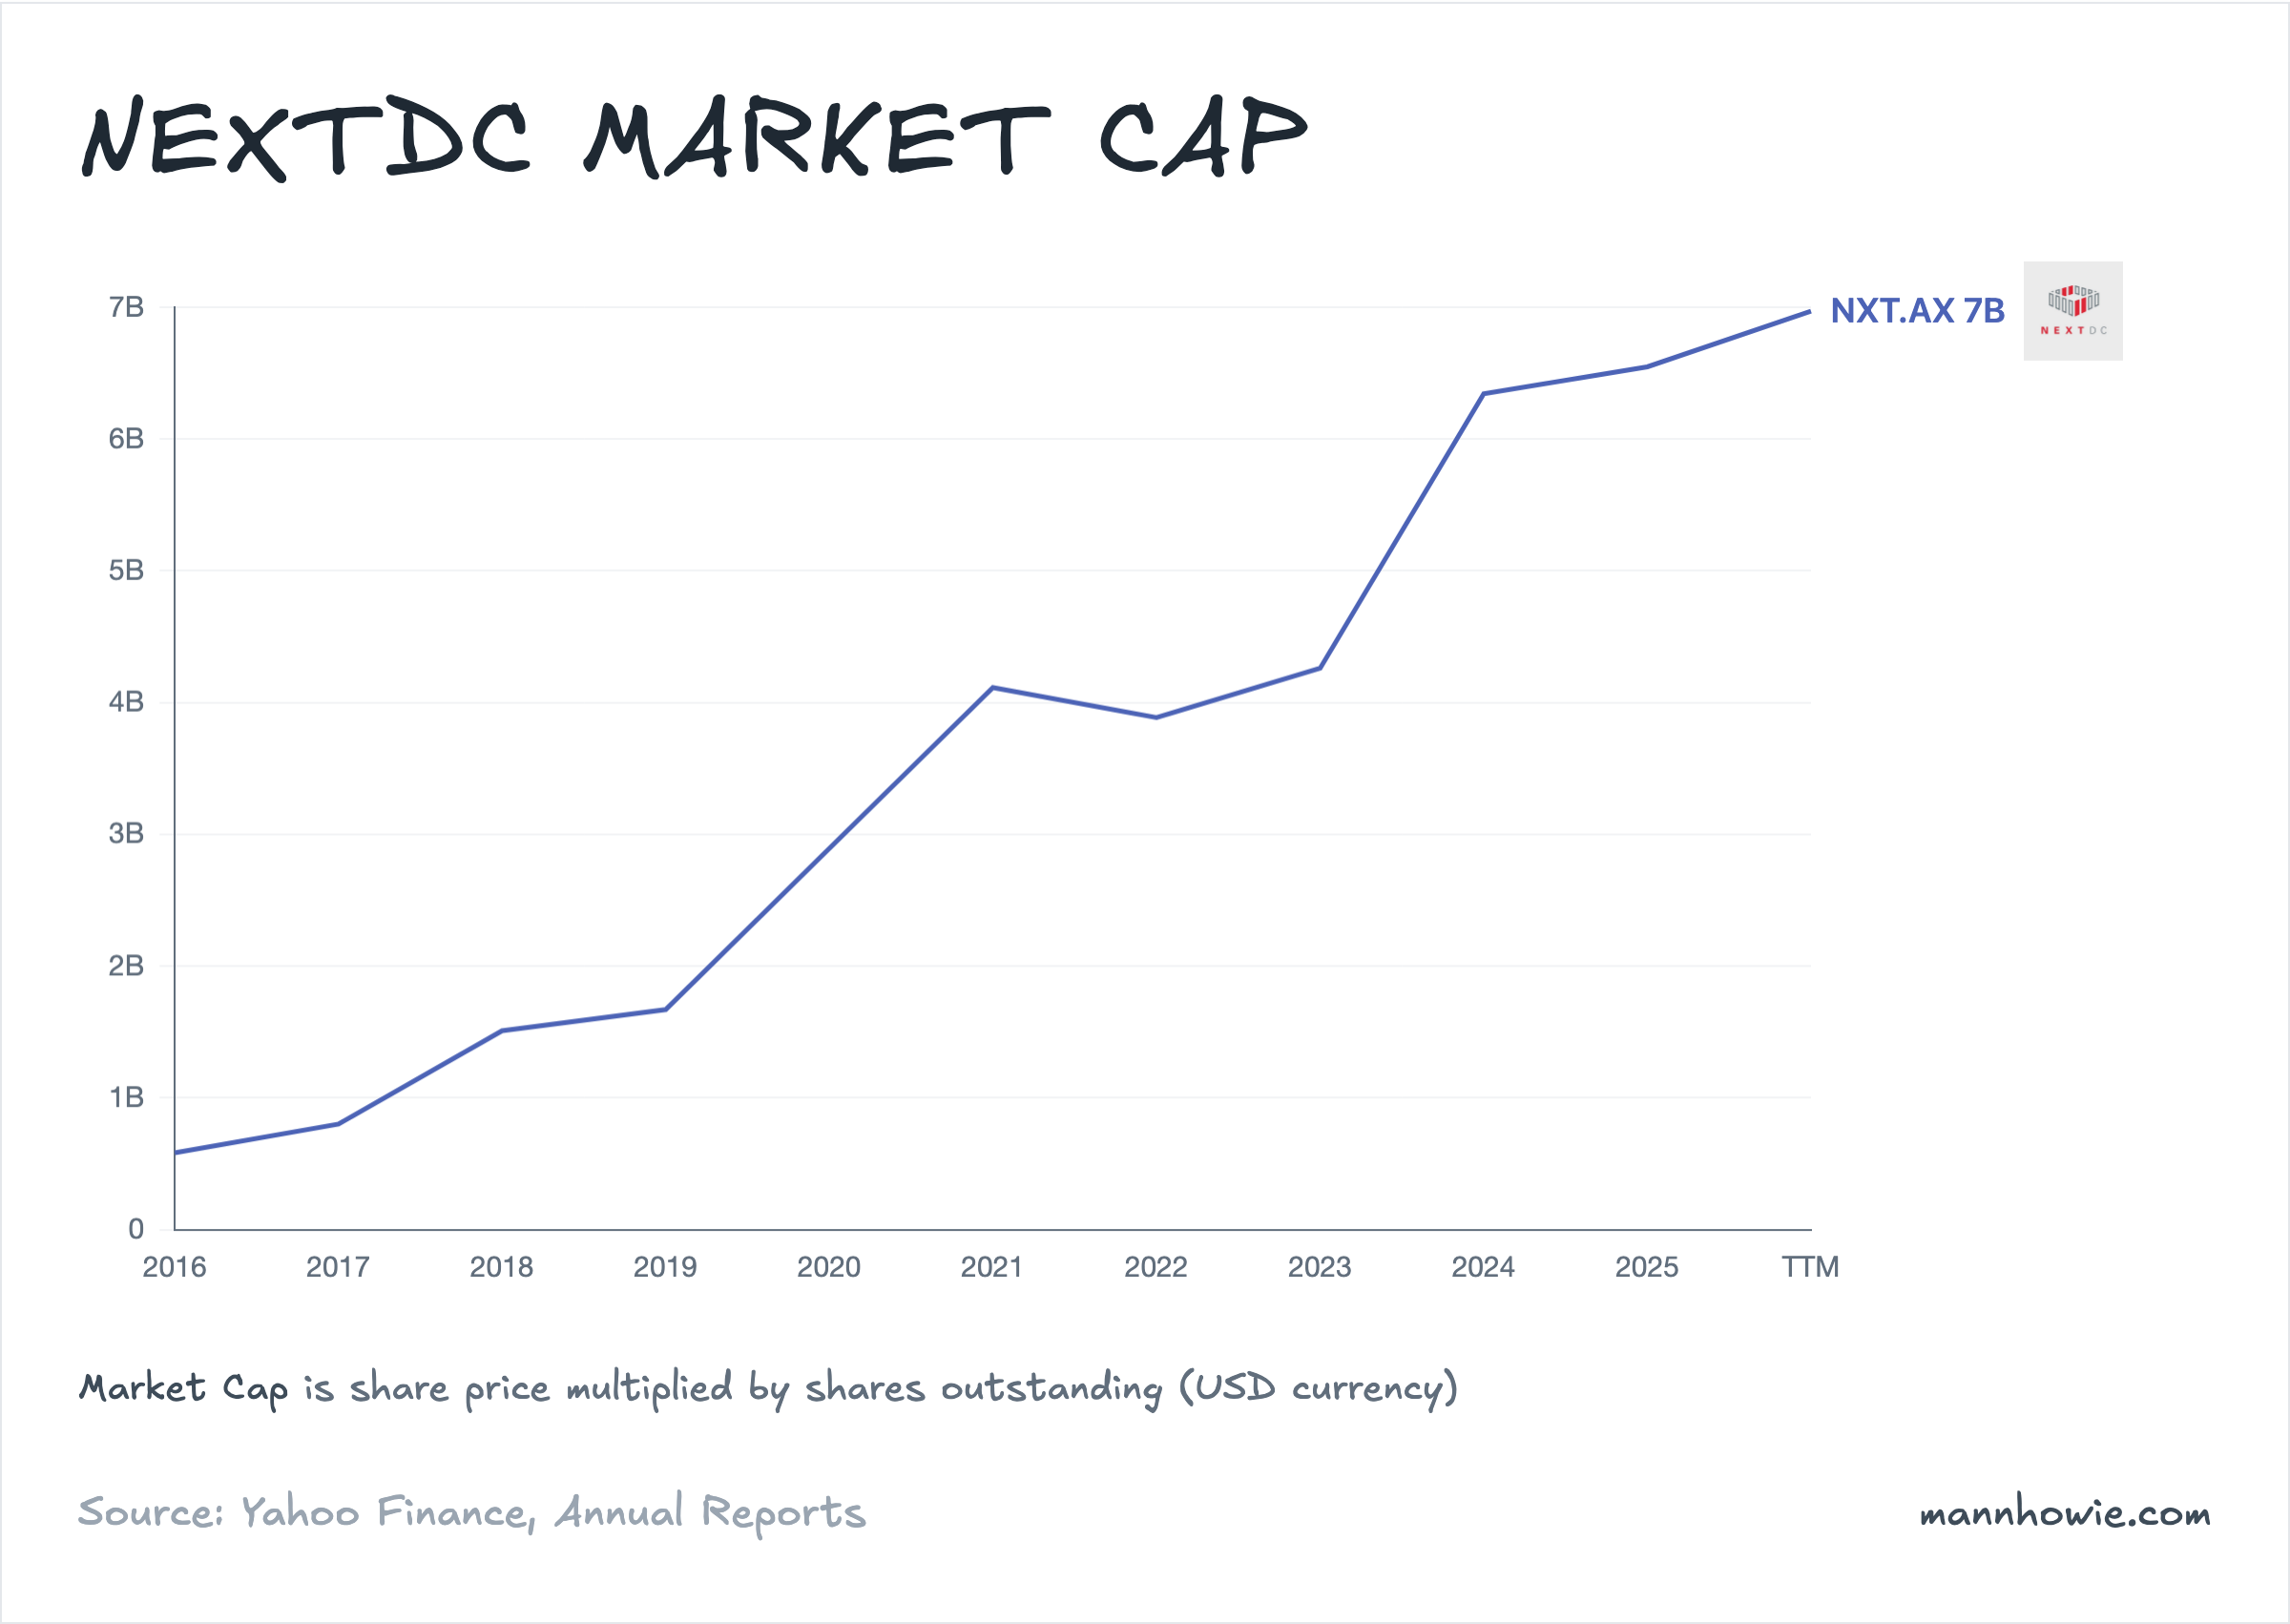
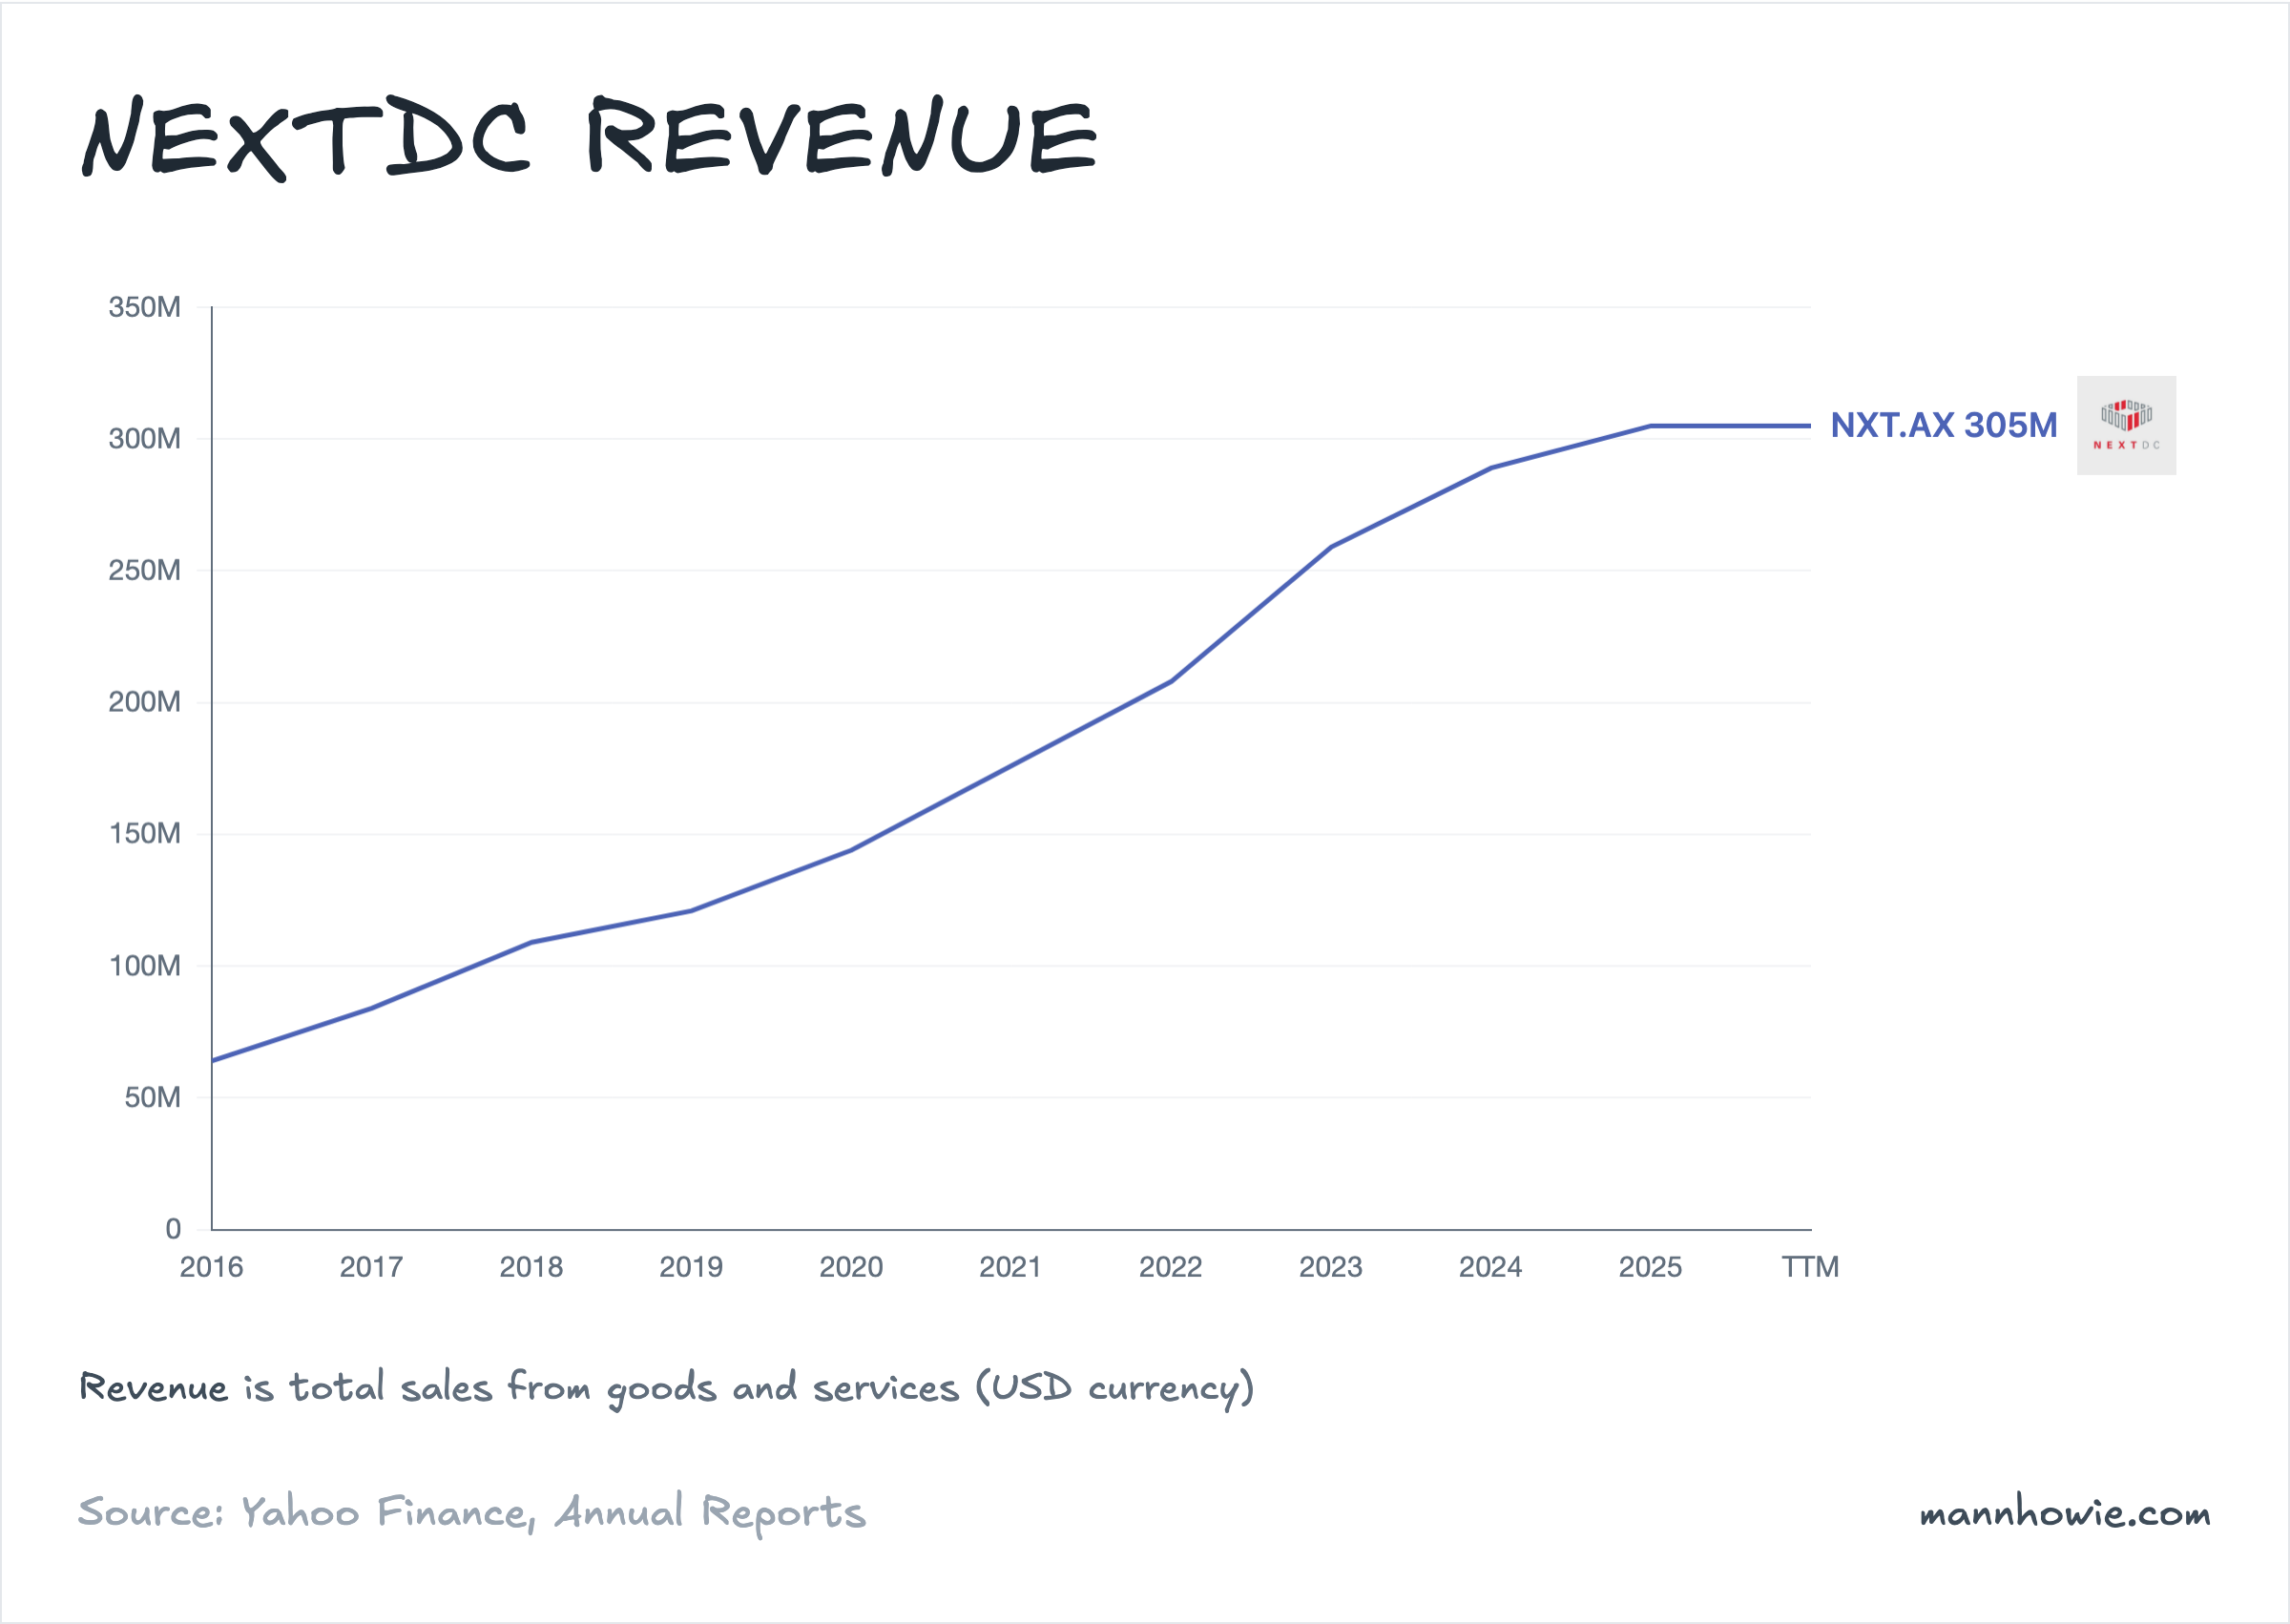
| NEXTDC | Australia / Asia-Pac | 241 MW built, 1.8 GW planned | USD ~280M | ~7B |
NEXTDC is about 1/15th the size of Equinix and 1/10th of Digital Realty by market cap. It is also the only one of the four global peers with a contracted book (667 MW) more than five times its current billing footprint (123 MW). The size gap is the build runway.
AirTrunk is the most direct overlap. Five Australian campuses across Sydney and Melbourne deliver more than 1.2 GW of deployable capacity, comparable to NEXTDC’s 1.8 GW planned book. The model splits cleanly: NEXTDC sells multi-tenant colocation with an interconnect layer; AirTrunk takes whole-building deals from a single hyperscaler at a time. Since the September 2024 Blackstone and CPP Investments acquisition at A$24B enterprise value, AirTrunk can underwrite the next 1 GW of build from a private balance sheet, which is the funding gap NEXTDC carries as a listed operator.
The customer mix has two faces
From FY24, NEXTDC splits utilisation across three customer categories: Cloud & AI, ICT Providers, and Enterprise & Government. By contracted megawatts the mix looks hyperscale-heavy. By interconnection revenue (the cross-connects that physically link tenants inside a building), it looks like a neutral hub.
| Customer category | MW (FY24) | MW (FY25) | MW (1H FY26) | Interconnect rev (1H FY26) |
|---|---|---|---|---|
| Cloud & AI | 80% | 86% | 88% | 9% |
| ICT Providers | 11% | 6% | 4% | 33% |
| Enterprise & Government | 9% | 8% | 8% | 59% |
One hyperscale contract takes 50 to 250 MW. A bank might take a single rack but pull dozens of cross-connects to cloud on-ramps, carriers and exchanges. Power skews to the hyperscaler. Network density skews to enterprise and ICT. By tenant count and interconnection revenue, NEXTDC is still genuinely neutral. By contracted MW, it is increasingly a hyperscale platform.
The capacity funnel: contracted runs five times ahead of billing
The economics work in four stages. NEXTDC locks in land and power (planned). It builds the halls (built). It signs customer contracts (contracted). Then it switches on the racks and starts billing. Revenue only flows at the last stage. The gap between contracted and billing is the Forward Order Book: capacity under firm contract that converts to revenue as halls come online.
A megawatt of leased capacity generates up to A$4M of annual revenue at roughly 50% EBITDA margin, against ~A$30M of land, build and fit-out capex. A 10 MW facility costs around A$300M to deliver, runs at A$40M of revenue and A$20M of EBITDA at full lease-up.
| Metric | FY2020 | FY2022 | FY2023 | FY2024 | FY2025 | 31 Mar 26 PF* |
|---|---|---|---|---|---|---|
| Planned IT power (MW) | 246 | 441 | 970 | 1,010 | 1,740 | 1,815 |
| Contracted (MW) | 70 | 83 | 122 | 173 | 245 | 667 |
| Built (MW) | 79 | 114 | 133 | 165 | 208 | 241 |
| Billing (MW) | 53 | 73 | 78 | 86 | 111 | 123 |
| Revenue per MW (A$M) | 3.9 | 4.0 | 4.6 | 4.7 | 3.8 | 3.5 |
| Revenue (A$M) | 205 | 291 | 362 | 404 | 427 | 2,335 |
| Underlying EBITDA (A$M) | 105 | 169 | 194 | 204 | 217 | 1,000 |
| EBITDA margin | 51% | 58% | 53% | 51% | 51% | 43% |
| Capex per MW added (A$M) | 21 | 32 | 35 | 32 | 40 | ~32 |
*PF revenue = 667 MW × A$3.5M/MW, below the historical range to reflect hyperscale dilution. PF EBITDA = management’s >A$1.0B guidance at full conversion, or ~A$1.5M EBITDA per MW versus the historical A$2M run-rate. PF capex per MW reflects NEXTDC’s long-run A$31.5M build cost anchor.
A record 250 MW contract at S4 Western Sydney in April 2026 lifted pro forma contracted utilisation to 667 MW and the Forward Order Book to 544 MW. That is more than four times current billing. Management expects the full contracted book to generate over A$1.0B of EBITDA once online, four times the FY2026 guidance of A$235M. The implied A$1.5M EBITDA per MW sits below the historical A$2M run-rate. Either hyperscale unit economics are softer, or the guidance excludes some opex layers.
“At the close of the FY25 reporting period, our contracted pipeline exceeds all we have built to date. This is a clear signal of accelerating demand for trusted AI-ready infrastructure and it positions us to more than double revenue and EBITDA in the next few years.”
Craig Scroggie, CEO, NEXTDC FY2025 Annual Report
AI capex from hyperscalers is the demand engine
| Hyperscaler capex (USD M) | FY2022 | FY2025 | 3Y Change ($) |
|---|---|---|---|
| Amazon | 63,645 | 131,819 | +68,174 |
| Alphabet | 31,485 | 91,447 | +59,962 |
| Meta | 31,186 | 69,691 | +38,505 |
| Microsoft | 23,886 | 64,551 | +40,665 |
| Oracle | 4,511 | 21,215 | +16,704 |
| Total | 154,713 | 378,723 | +224,010 |
The five biggest cloud companies spent USD 379B on capex in FY2025, more than double the USD 155B in FY2022. Every GPU cluster needs a building, grid power, and a network on-ramp. NEXTDC sits in the path of the slice that lands in metropolitan Australia. McKinsey expects Australian data centre demand to grow 21%+ a year, from ~1.5 GW in CY2025 to ~3.9 GW by CY2030, with a ~400 MW supply shortfall in CY2026.
The build costs nearly three times the prior decade
| Metric (A$M) | FY2022 | FY2023 | FY2024 | FY2025 | 1H FY2026 | FY26 guide | FY27 fcst |
|---|---|---|---|---|---|---|---|
| Revenue | 291 | 362 | 404 | 427 | 232 | n/d | n/d |
| Underlying EBITDA | 169 | 194 | 204 | 217 | 115 | 235 | n/d |
| Net profit (loss) | 9 | (26) | (44) | (61) | (39) | n/d | n/d |
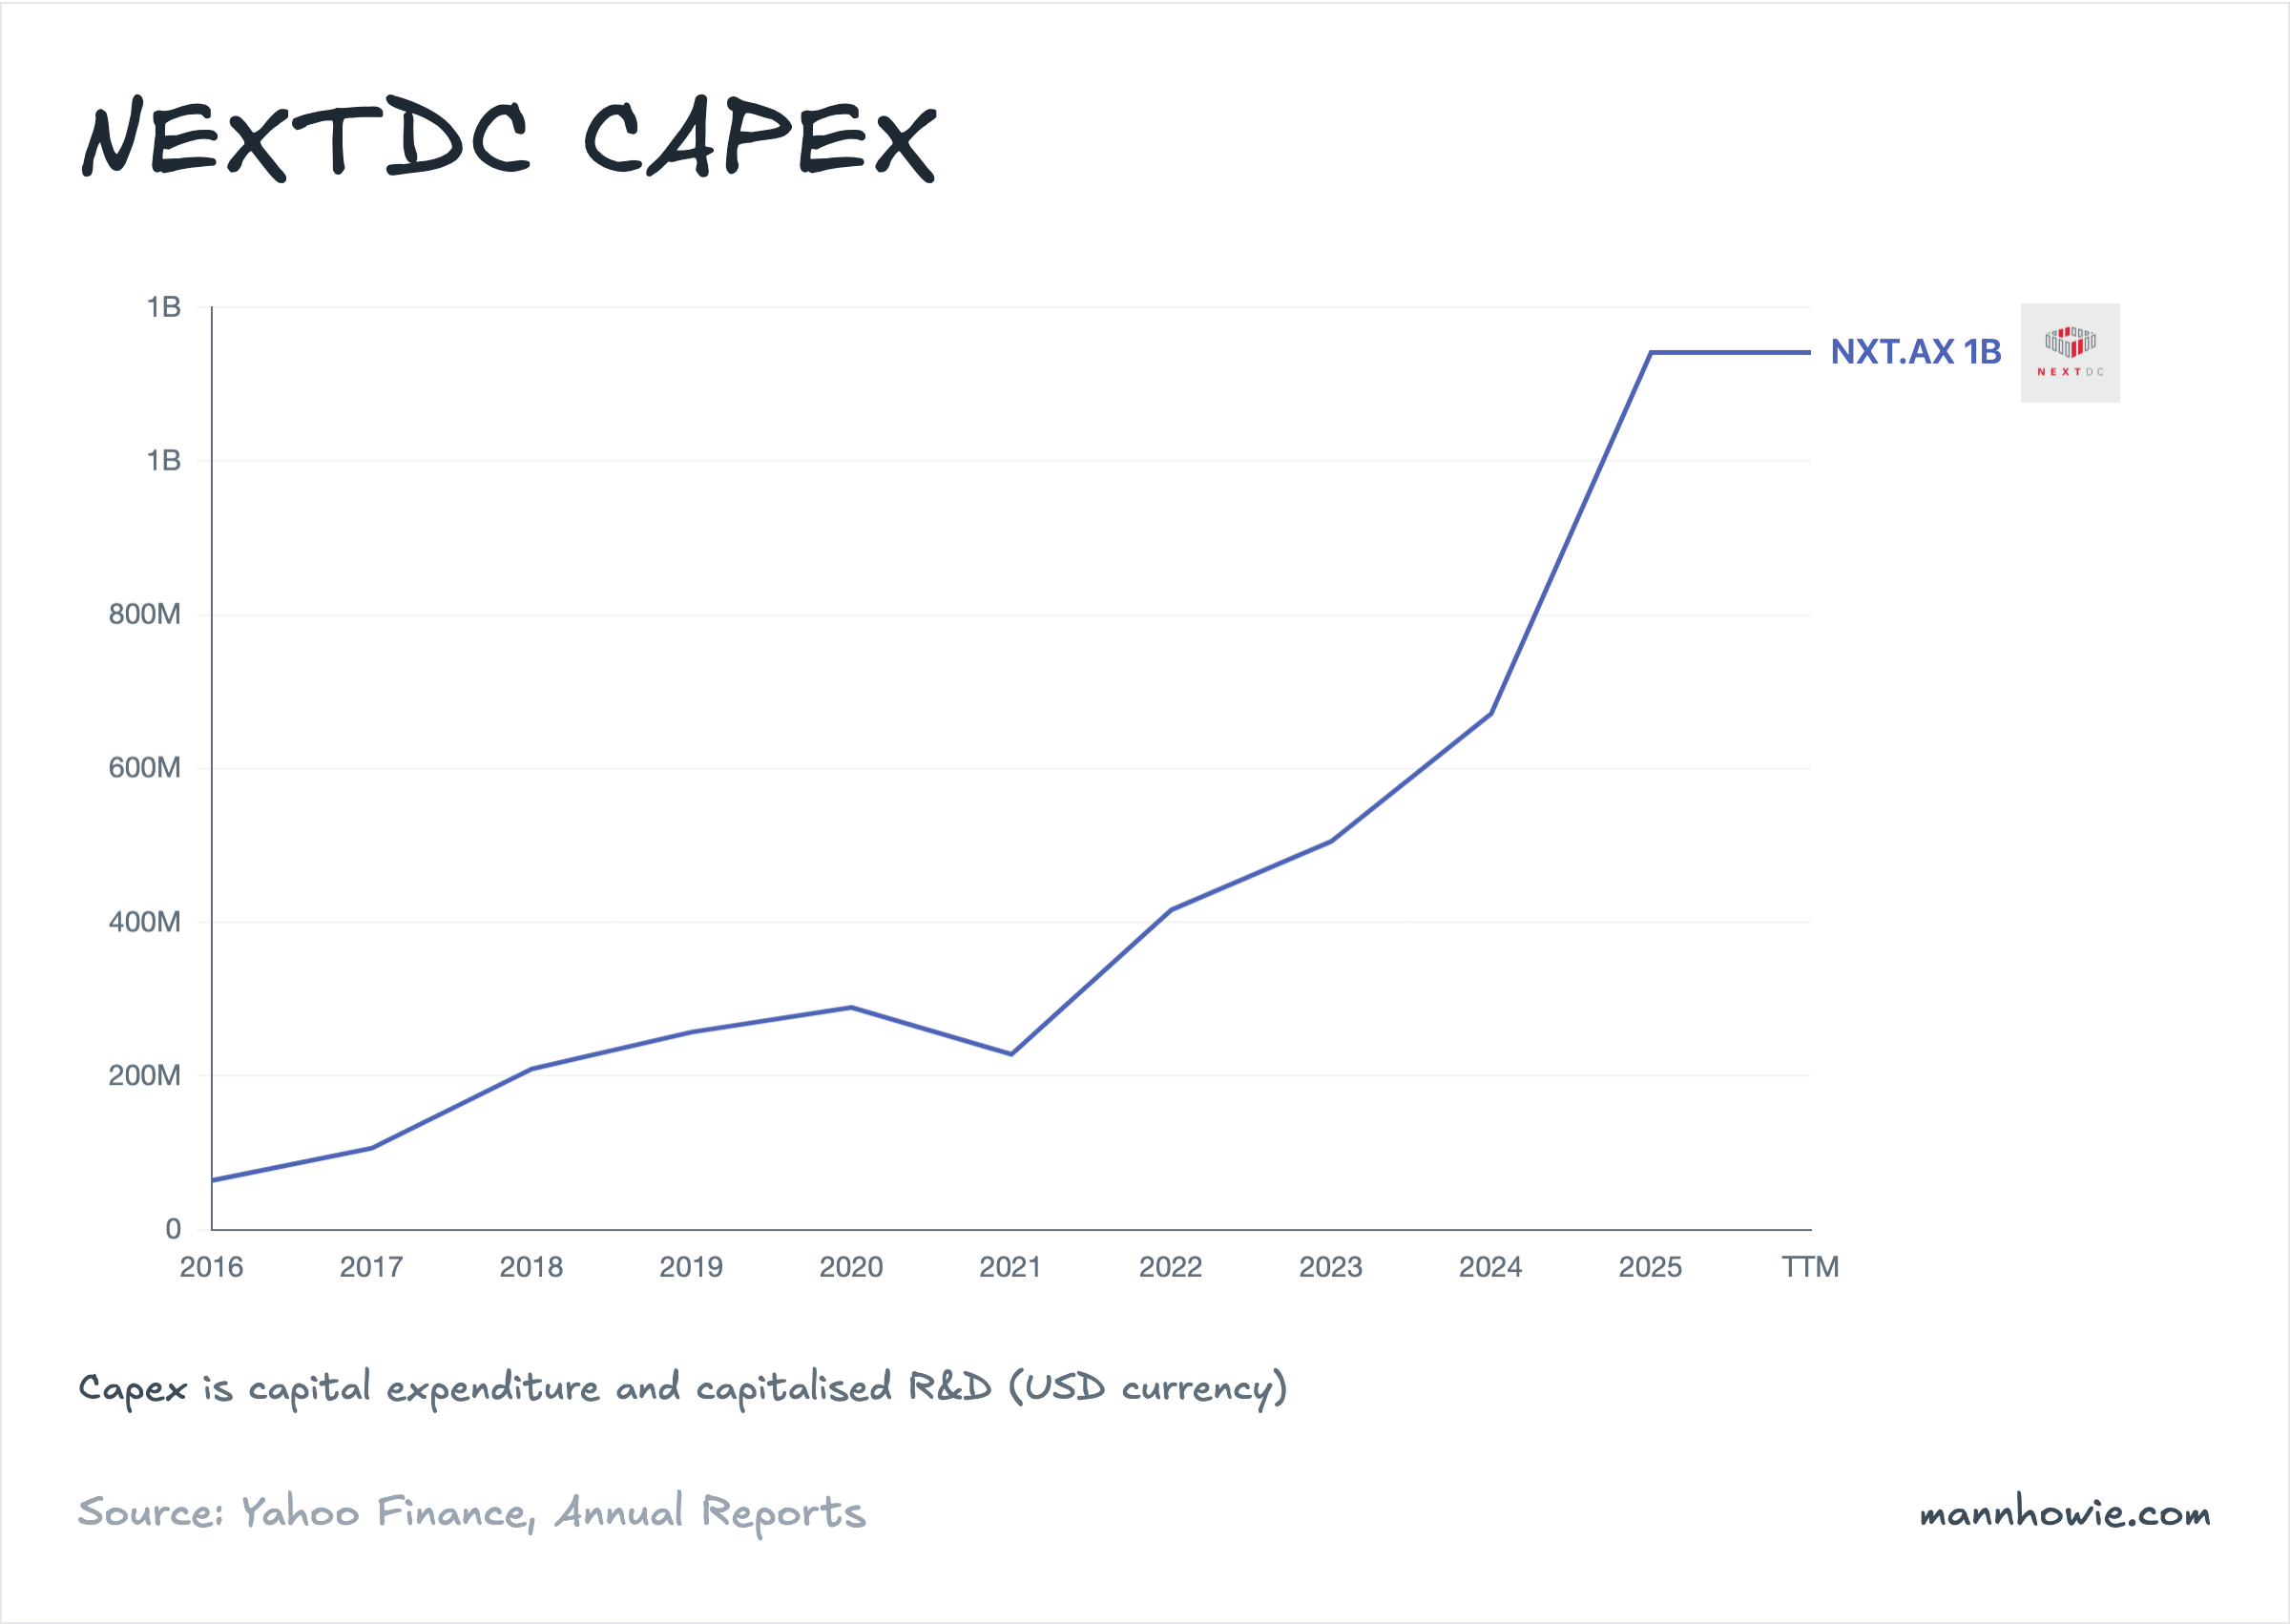
| Capex | 582 | 690 | 1,003 | 1,699 | 1,284 | 2,850 | 5,000 |
| Operating cash flow | 117 | 127 | 129 | 223 | 36 | n/d | n/d |
FY2025 capex was A$1.7B, four times revenue. FY2026 guidance: A$2.7-3.0B. FY2027 forecast: ~A$5.0B. The major builds: S4 Sydney (~350 MW), M3 Melbourne (~225 MW), S7 Sydney (~550 MW+), M4 Melbourne (~150 MW), and S5 Sydney (~80 MW+).
Cumulative capex over the past decade (FY2016 to FY2025) was A$5.6B. That delivered today’s 208 MW of built capacity. Building the remaining 426 MW of the contracted book through FY30 is sized at A$13-17B at NEXTDC’s recent A$31-36M per MW range. Management’s base case in the April 2026 capital raise deck is ~A$15B from FY26 onwards. Almost three times what NEXTDC built in the prior decade combined, compressed into four years.
Funded to FY27, with a A$4.5bn equity gap to FY30
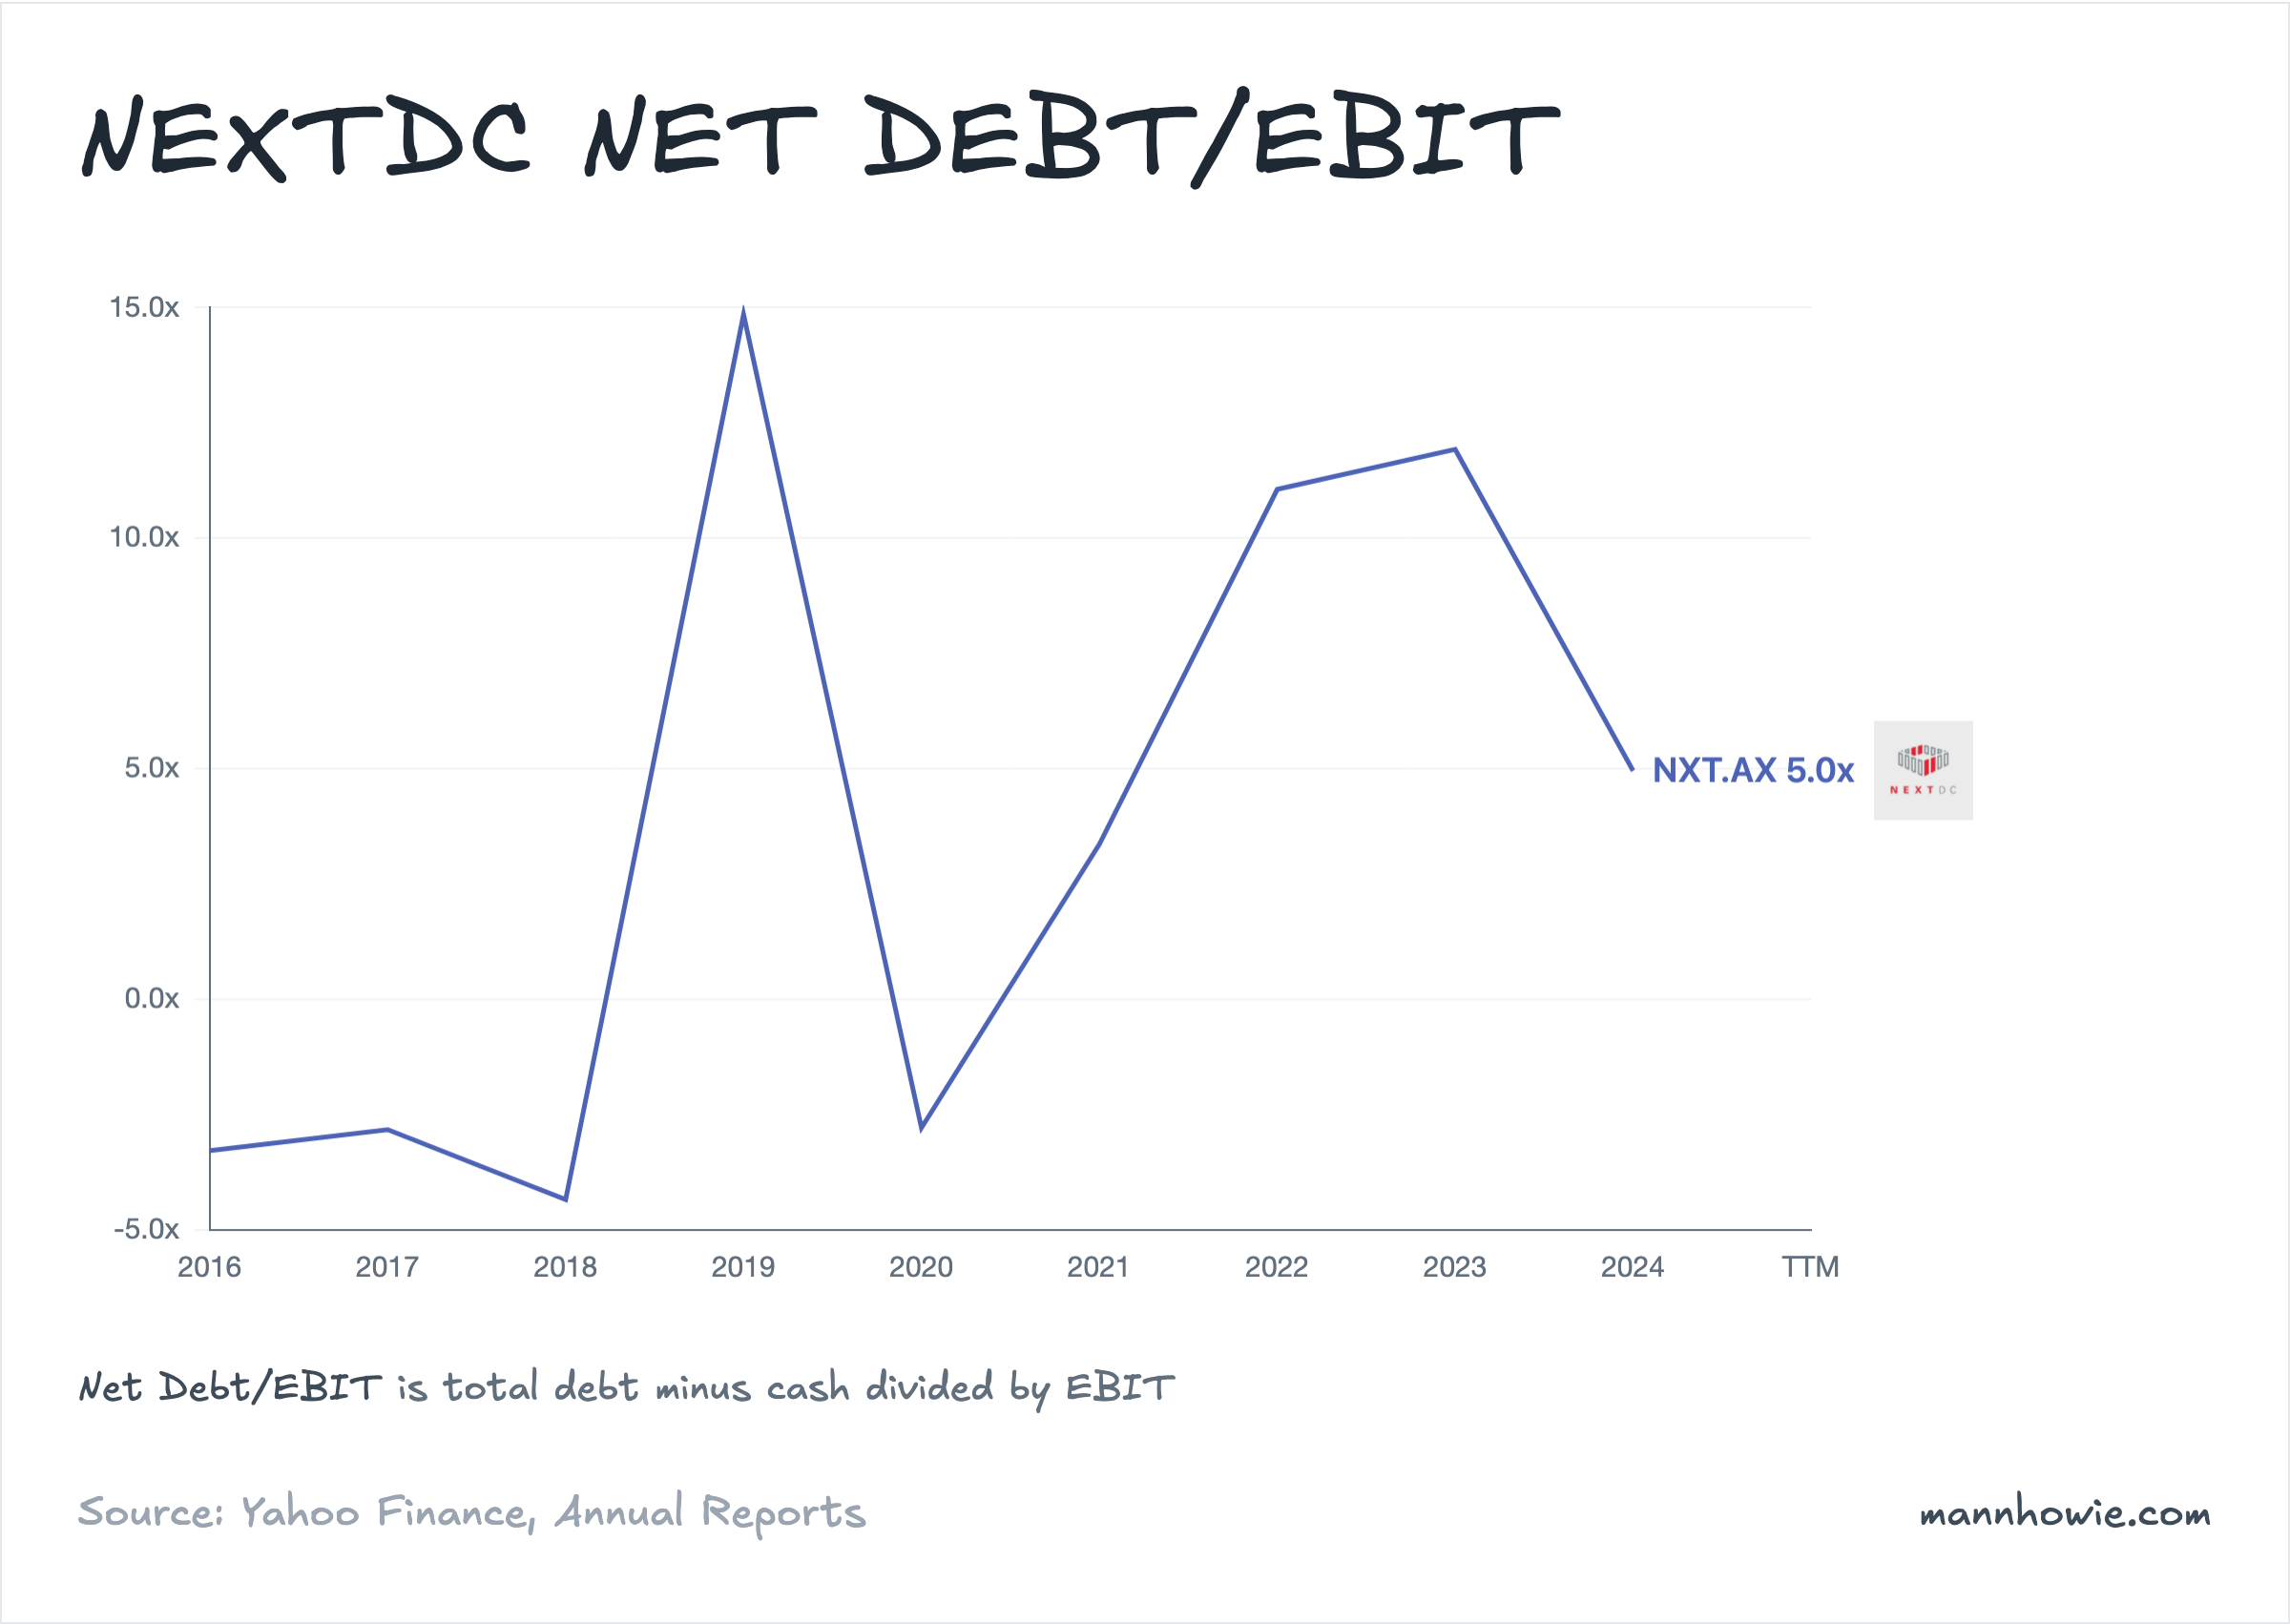
The April 2026 capital raise totalled A$2.2B: a A$1.5B entitlement offer at A$12.70 a share, plus A$1.7B in hybrid securities anchored by La Caisse de dépôt et placement du Québec. That lifts pro forma liquidity to A$5.9B and pulls Net Debt/EBITDA from 9.3x at 31 December 2025 to 2.8x. Add A$3.9B of undrawn facilities and ~A$1.5B of additional senior debt described as “well advanced.” FY26 capex of A$2.85B and the FY27 forecast of A$5.0B are covered, with a small buffer.
| Period | Capex (A$bn) | Funding sources | Status |
|---|---|---|---|
| FY26 | 2.85 | 1H26 liquidity + April 2026 raise | covered |
| FY27 | 5.00 | PF liquidity + senior debt + wholesale notes + OCF | covered |
| FY28-FY30 | ~7.00 | OCF ~A$1.5B + JVCo sell-down ~A$1.5B + further debt + equity | gap of ~A$4.5B |
The structural problem is the second leg. Net Debt/EBITDA climbs back toward 9x by 30 June 2026 once 2H26 capex is deployed, and would breach management’s gearing ceiling without more equity. Hold gearing at 30% by FY30 and assume A$1.5B of proceeds from the planned S4/S7 JVCo sell-down. The residual equity raise needed across CY28 to CY30 is A$4.5B. That is three times the size of the April 2026 entitlement offer and roughly 1.4x all the equity NEXTDC has issued since FY21 combined.
| Equity action | Size (A$bn) |
|---|---|
| FY21 placement + SPP | 0.86 |
| FY22 placement | 0.62 |
| FY24 placement + SPP | 1.32 |
| April 2026 entitlement | 1.51 |
| April 2026 hybrid (La Caisse) | 1.70 |
| Implied FY28-FY30 (base case) | 4.50 |
The JVCo path copies Equinix’s xScale joint ventures with GIC and CPPIB. Build hyperscale facilities on balance sheet, sell partial interests to sovereign wealth, recycle the capital, keep operational control. NEXTDC targets a JVCo for FY27+, once construction milestones land and contracts are further de-risked.
What the data shows
Contracted capacity grew from 122 MW in FY2023 to 667 MW in March 2026, a 5.5x lift in under three years. Delivering it needs close to A$15B of capex over four years, almost three times what NEXTDC built in the prior decade combined. The April 2026 raise covers FY26 and FY27. The gearing arithmetic implies a second equity action of A$1.5-4.5B across CY28 to CY30, alongside a JVCo sell-down of the largest Sydney campuses. The funding loop closes when contracted MW starts converting to billing revenue from FY28 onwards.
Sources
- NEXTDC Annual Reports FY2016-FY2025: revenue, EBITDA, capex, net loss, segment data, financial statements (balance sheet, cash flow, debt facilities), CEO letters; capacity metrics from operational tables.
- NEXTDC Results Presentations FY2019-FY2025 and 1H FY2024-1H FY2026: utilisation, built capacity, revenue per MW, power density mix, debt profiles, forward guidance. Customer mix by category for contracted MW and interconnection revenue: 1H26 Results Presentation, slide 15 (as at 31 Dec 2025); FY25 Results Presentation, slide 15; FY24 Results Presentation, slide 14 (first year of the three-category framework). Pre-FY24 presentations used a different framework (customers by industry across seven buckets, by customer count not MW), not directly comparable.
- NEXTDC Capital Raise Presentation, 20 April 2026: 250 MW S4 contract, pro forma 667 MW, Forward Order Book 544 MW, contracted EBITDA >A$1.0B, A$2.2B capital plan, A$5.9B pro forma liquidity, FY26 capex guidance A$2.7-3.0B, FY27 capex forecast ~A$5.0B, JVCo structure, Australian market demand (McKinsey).
- Equinix 10-K FY2025; Digital Realty 10-K FY2025; NTT GDC public filings: peer capacity and revenue.
- AirTrunk press releases (airtrunk.com), 2025-2026: Australian campus capacities (SYD1-3, MEL1-2), 1.2 GW Australian deployable, 2.6 GW APAC + Middle East total. Blackstone press release, 4 September 2024: A$24B (USD 16.1B) acquisition by Blackstone and CPP Investments, ~800 MW committed at deal.
- Microsoft, Alphabet, Amazon, Meta, Oracle 10-K FY2025 filings: capital expenditure FY2022-FY2025.