Tesla vs BYD: Volume, Vertical Integration and a Ten-Times Valuation Gap
7 minute read | Apr 21, 2026 | Reviewed by Howie Mann
BYD now sells more cars, books more revenue and earns more operating profit than Tesla. Tesla is worth ten times as much. Why? Because, Elon Musk is building a bigger market beyond EVs.
“Optimus [Autonomous Robots] at scale is the infinite money glitch. It’s difficult to express the magnitude of… if Optimus, I think, probably achieves five times the productivity of a person per year because it can operate twenty-four seven. It doesn’t even need to charge. It can operate tethered… There is not really a limit to AI that is embodied. That’s why I called the infinite money glitch.”
— Elon Musk, Tesla Q3 FY2025 earnings call
Tesla designs and manufactures electric vehicles, battery storage systems and solar products. Revenue comes from vehicle sales (Model 3, Model Y, Model S/X and Cybertruck), regulatory credits, services and a fast-growing energy generation and storage business.
BYD (Build Your Dreams) is a Chinese manufacturer of electric and hybrid vehicles, power batteries, photovoltaic products and consumer electronics components. Revenue splits between two reportable segments: automobiles and related products, which includes internally consumed batteries, and mobile handset components and assembly through majority-owned BYD Electronic.
Revenue
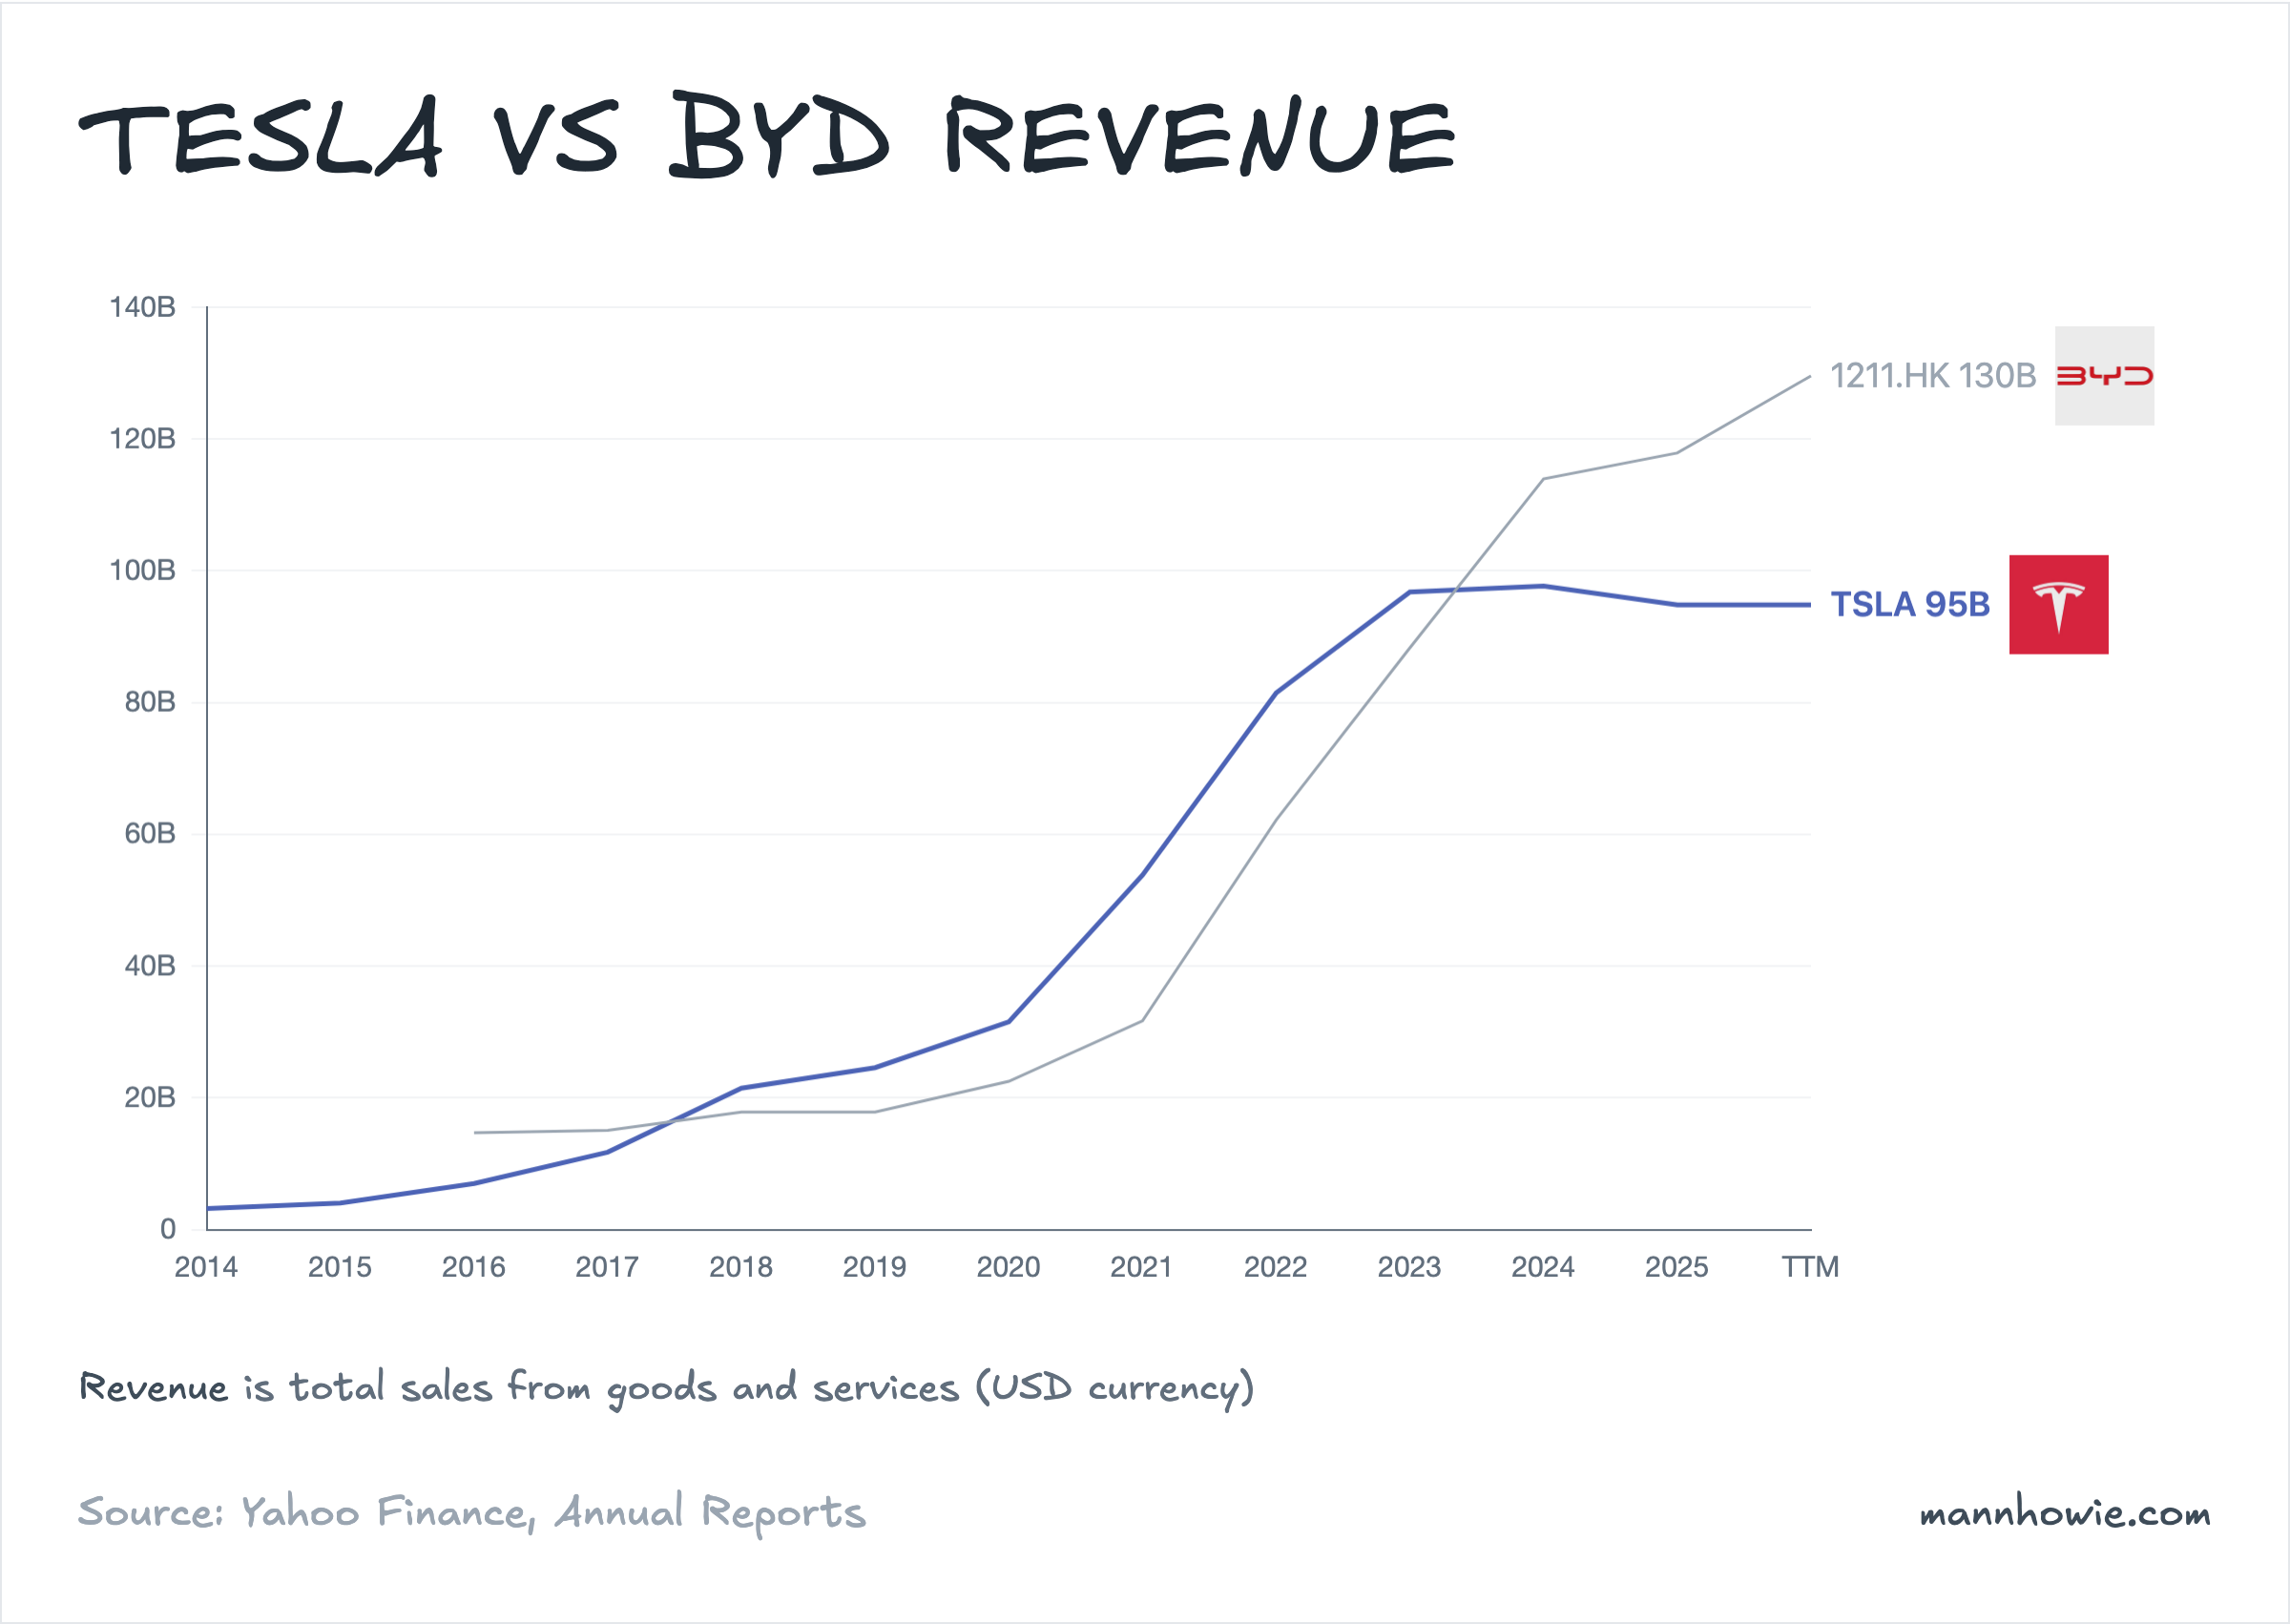
BYD overtook Tesla on revenue in FY2023 and has pulled further ahead since. In FY2025 BYD posted $117.9B against Tesla’s $94.8B. Over three years BYD added roughly four times the absolute revenue Tesla did from a similar starting base.
Tesla: revenue by line item
| Line item (USD M) | FY2022 | FY2023 | FY2024 | FY2025 | % of FY25 | 3Y CAGR | 3Y Change ($) |
|---|---|---|---|---|---|---|---|
| Automotive sales | 67,210 | 78,509 | 72,480 | 65,821 | 69.4% | -0.7% | -1,389 |
| Energy generation and storage | 3,909 | 6,035 | 10,086 | 12,771 | 13.5% | 48.3% | +8,862 |
| Services and other | 6,091 | 8,319 | 10,534 | 12,530 | 13.2% | 27.2% | +6,439 |
| Automotive regulatory credits | 1,776 | 1,790 | 2,763 | 1,993 | 2.1% | 3.9% | +217 |
| Automotive leasing | 2,476 | 2,120 | 1,827 | 1,712 | 1.8% | -11.6% | -764 |
| Total revenue | 81,462 | 96,773 | 97,690 | 94,827 | 100% | 5.2% | +13,365 |
Tesla sold more cars in FY2025 than in FY2022 (1.8M vs 1.3M) but collected less revenue from them. Price cuts to defend share against Chinese rivals ran faster than cost reductions. Energy storage more than tripled to $12.8B on Megapack demand, offsetting part of the decline.
BYD: revenue by segment
| Segment (USD M) | FY2021 | FY2022 | FY2023 | FY2024 | % of FY24 | 3Y CAGR | 3Y Change ($) |
|---|---|---|---|---|---|---|---|
| Automobiles and related products | 18,905 | 47,599 | 70,875 | 90,508 | 79.4% | 68.5% | +71,603 |
| Mobile handset components and assembly | 12,674 | 14,487 | 17,383 | 23,398 | 20.5% | 22.6% | +10,724 |
| Adjustments and eliminations | 107 | 81 | 42 | 16 | 0.0% | n/m | -91 |
| Total revenue | 31,691 | 62,167 | 88,299 | 113,925 | 100% | 53.2% | +82,234 |
Automobiles and related products drives almost all of BYD’s growth, nearly quintupling in three years. BYD sold 4.27 million new energy vehicles in 2024, more than double Tesla’s 1.79 million. The edge is vertical integration: BYD makes its own batteries, powertrains and semiconductors, a structural cost advantage over peers sourcing packs from CATL.
Mobile handset components and assembly is BYD Electronic, which assembles smartphones for global OEMs. Revenue grew 22.6% annually, boosted by the 2024 acquisition of Jabil’s mobility business.
EBIT and margins
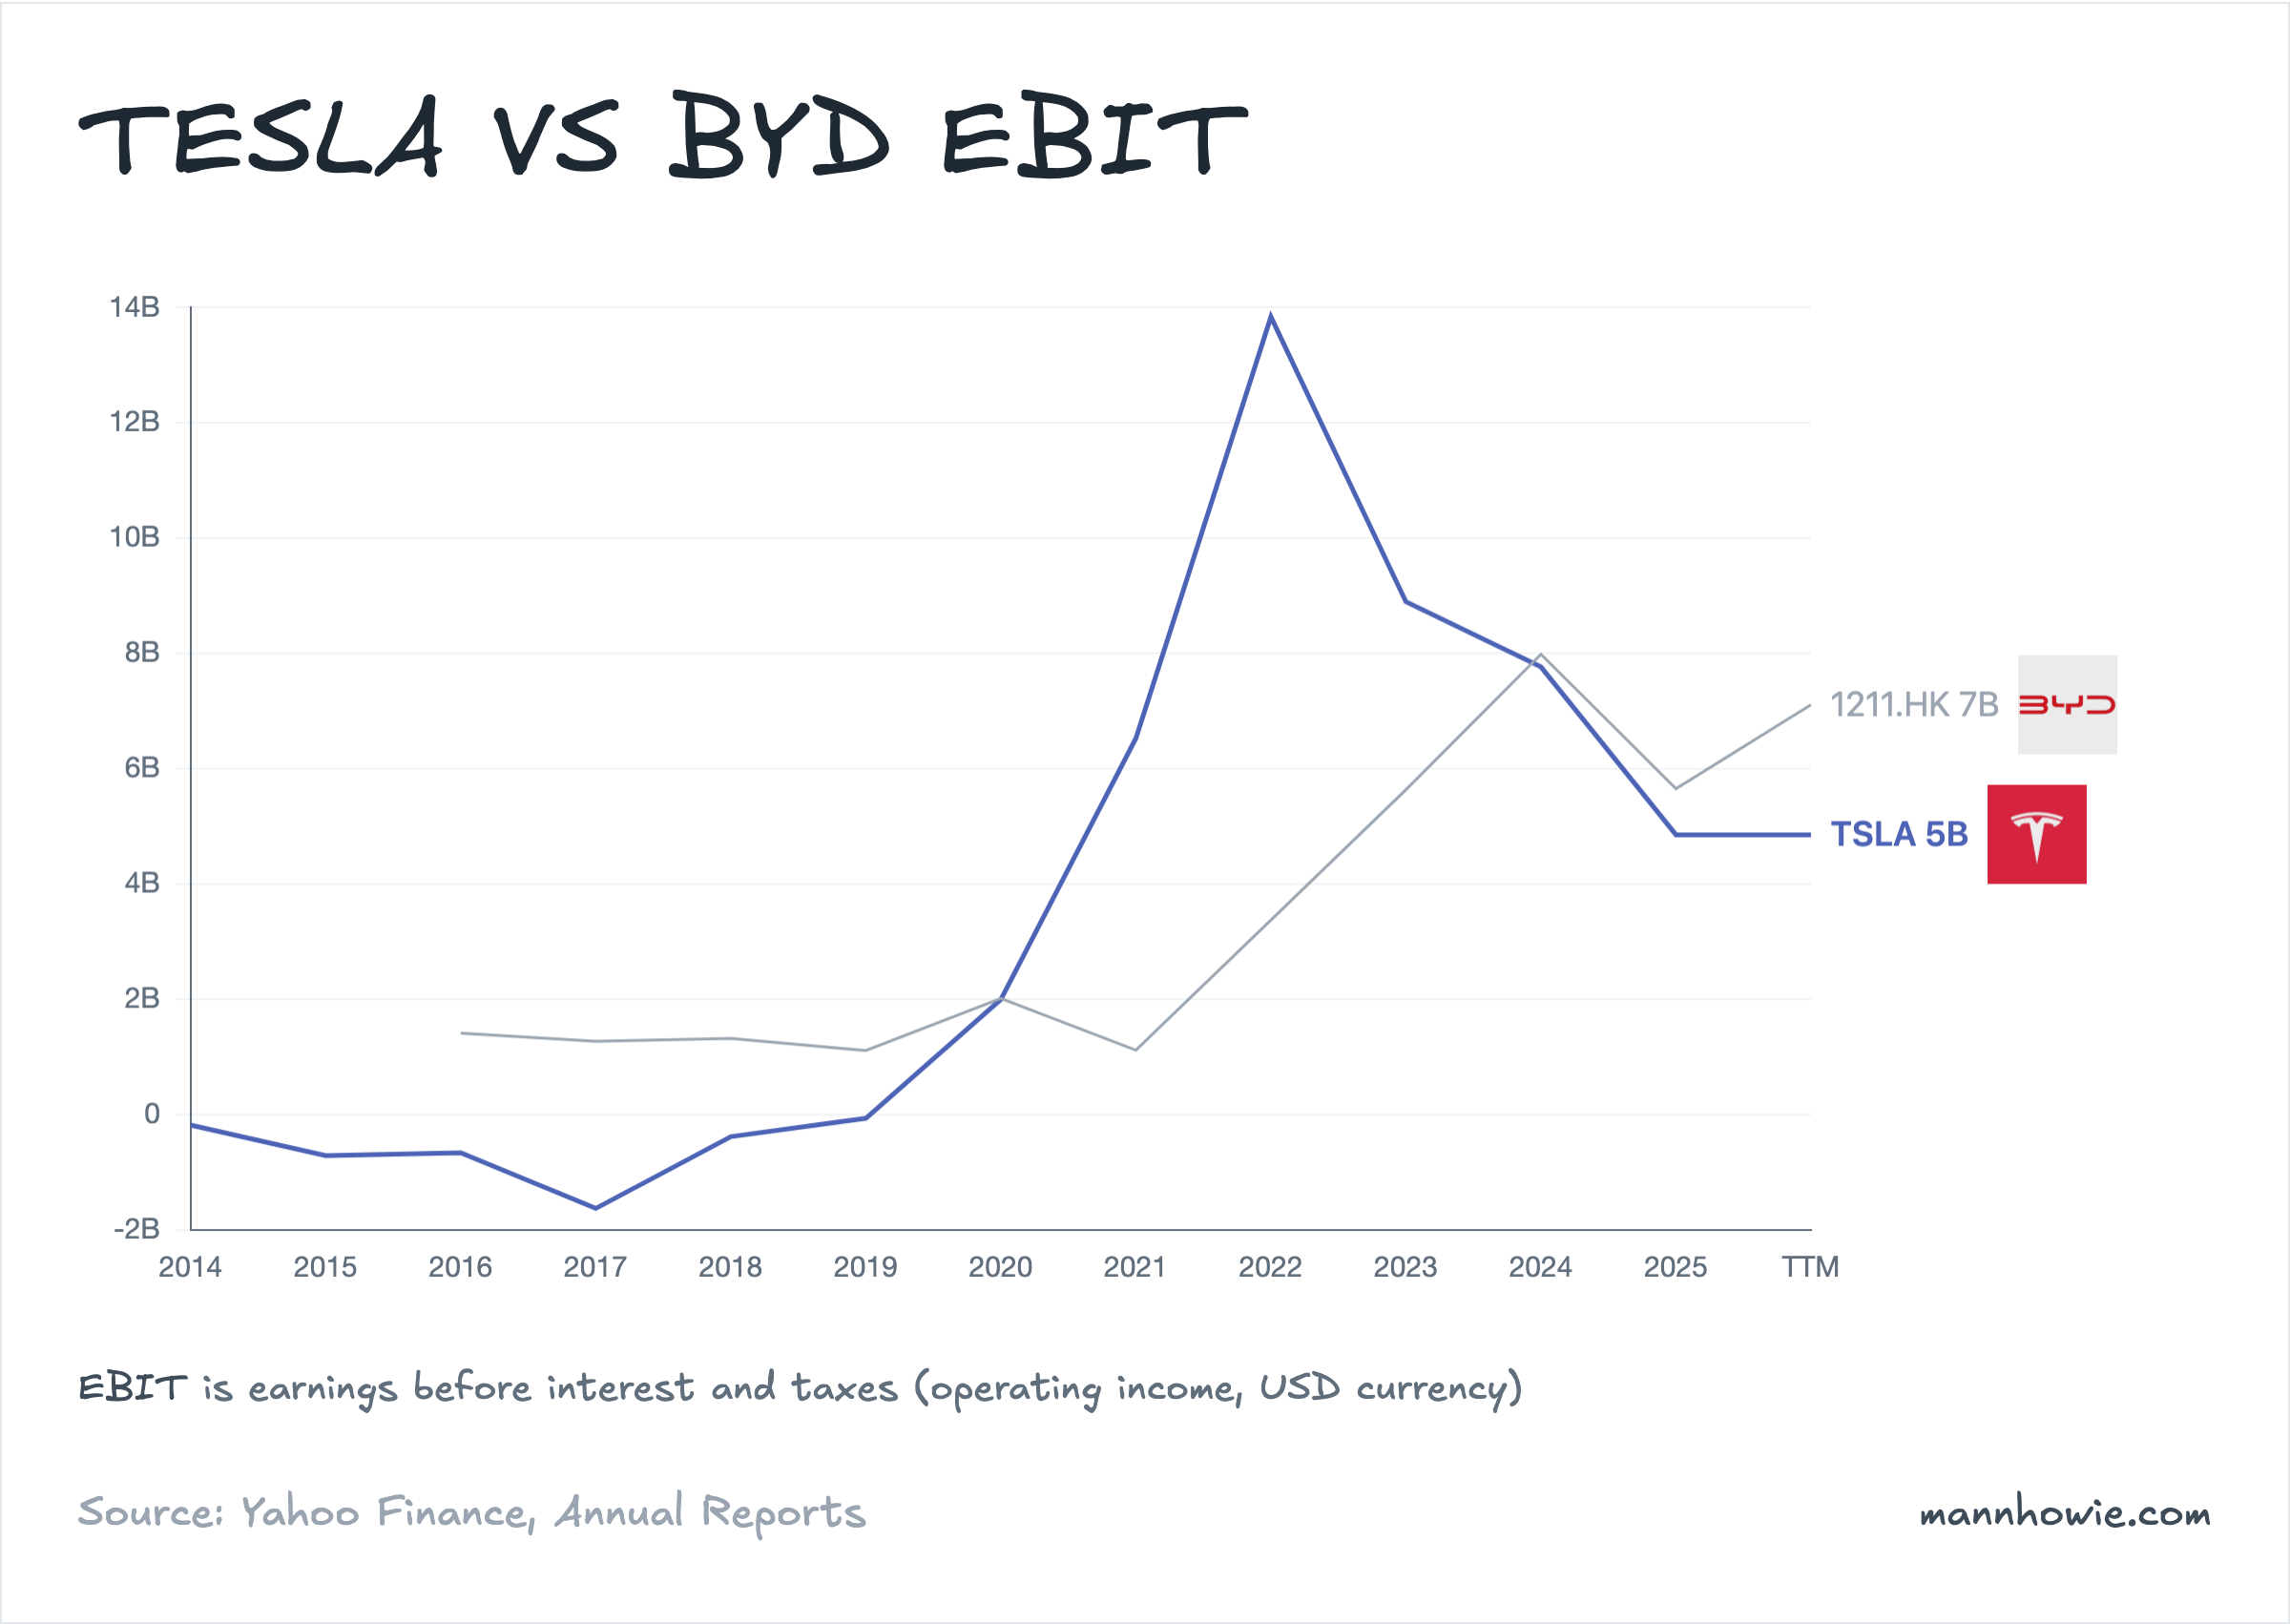
Tesla’s operating income has more than halved from a FY2022 peak of $13.8B to $4.9B in FY2025. BYD moved the other way, from $3.4B to $5.6B. The lines crossed in FY2024.
| Metric (FY2025) | Tesla | BYD | Gap |
|---|---|---|---|
| Revenue (USD M) | 94,827 | 117,878 | BYD +24% |
| EBIT (USD M) | 4,849 | 5,647 | BYD +16% |
| Operating margin | 5.1% | 4.8% | ~parity |
| Gross margin | 18.0% | 17.7% | ~parity |
| ROIC | 7.1% | 13.7% | BYD +6.6 pp |
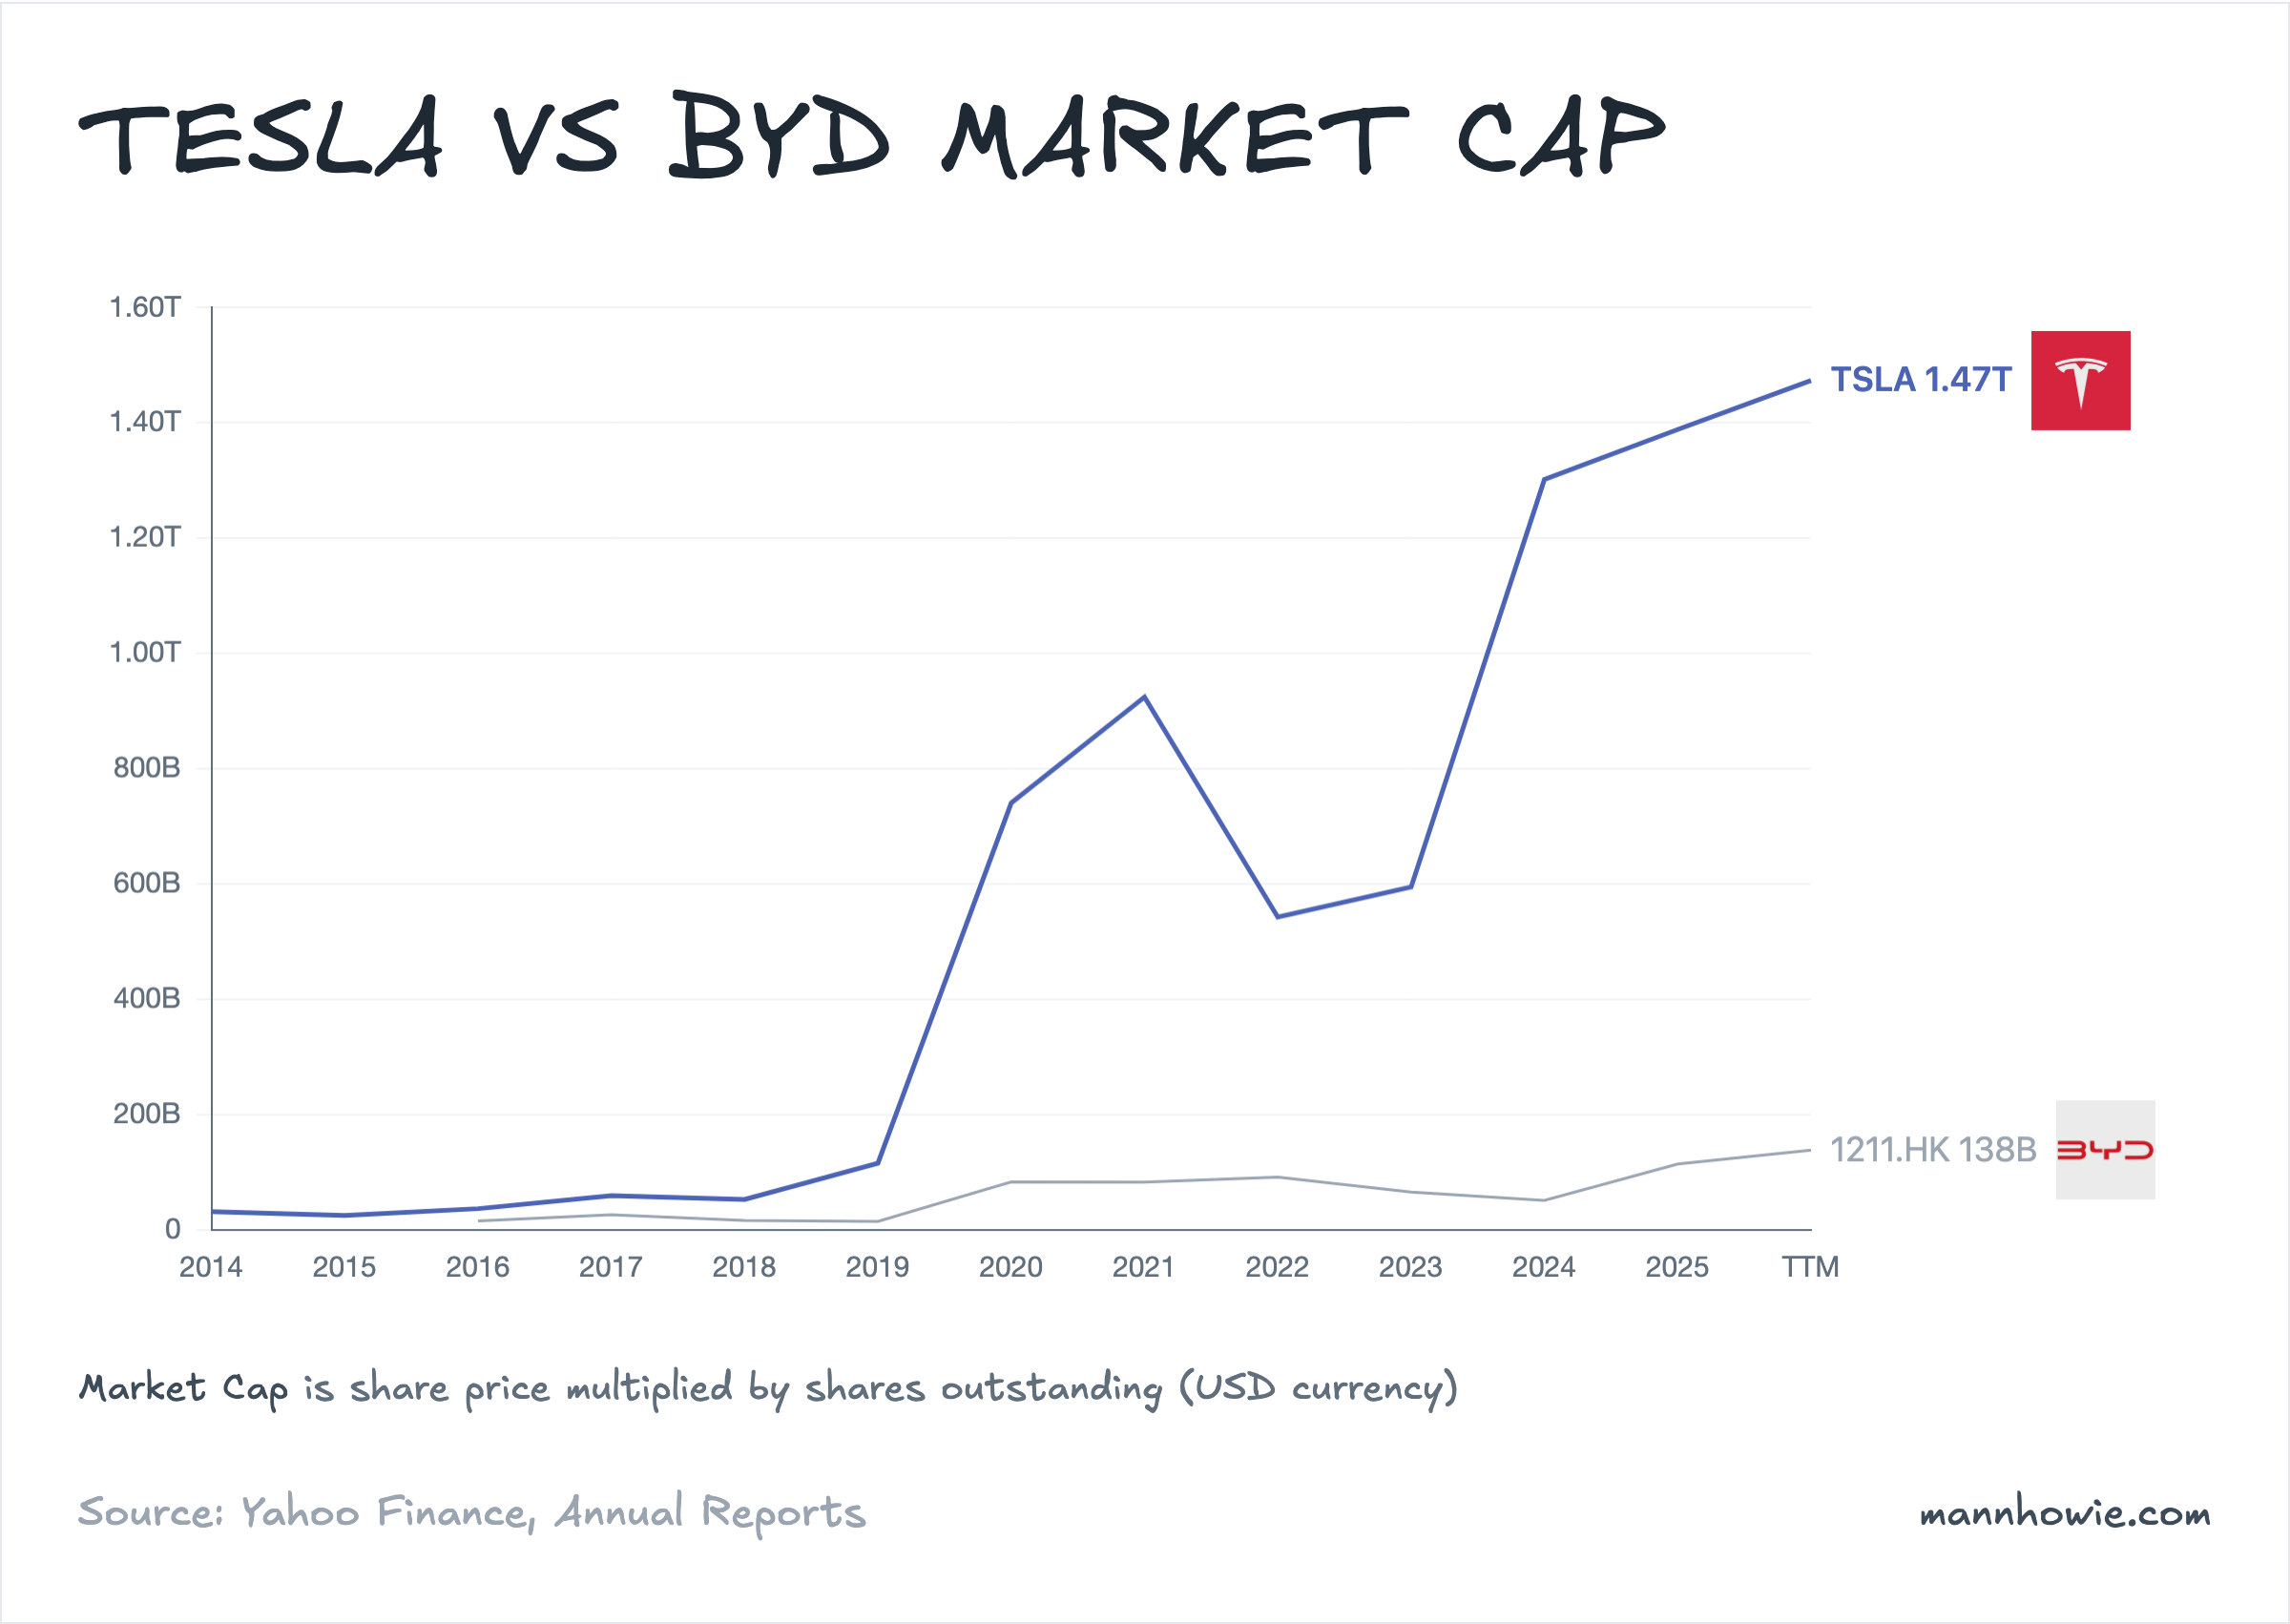
| Market cap (USD B) | 1,473 | 138 | TSLA 10.7x |
On the fundamentals Tesla has been overtaken on every line. Yet equity markets price the two at 297× EV/EBIT against 19×, and 388× P/E against 24×.
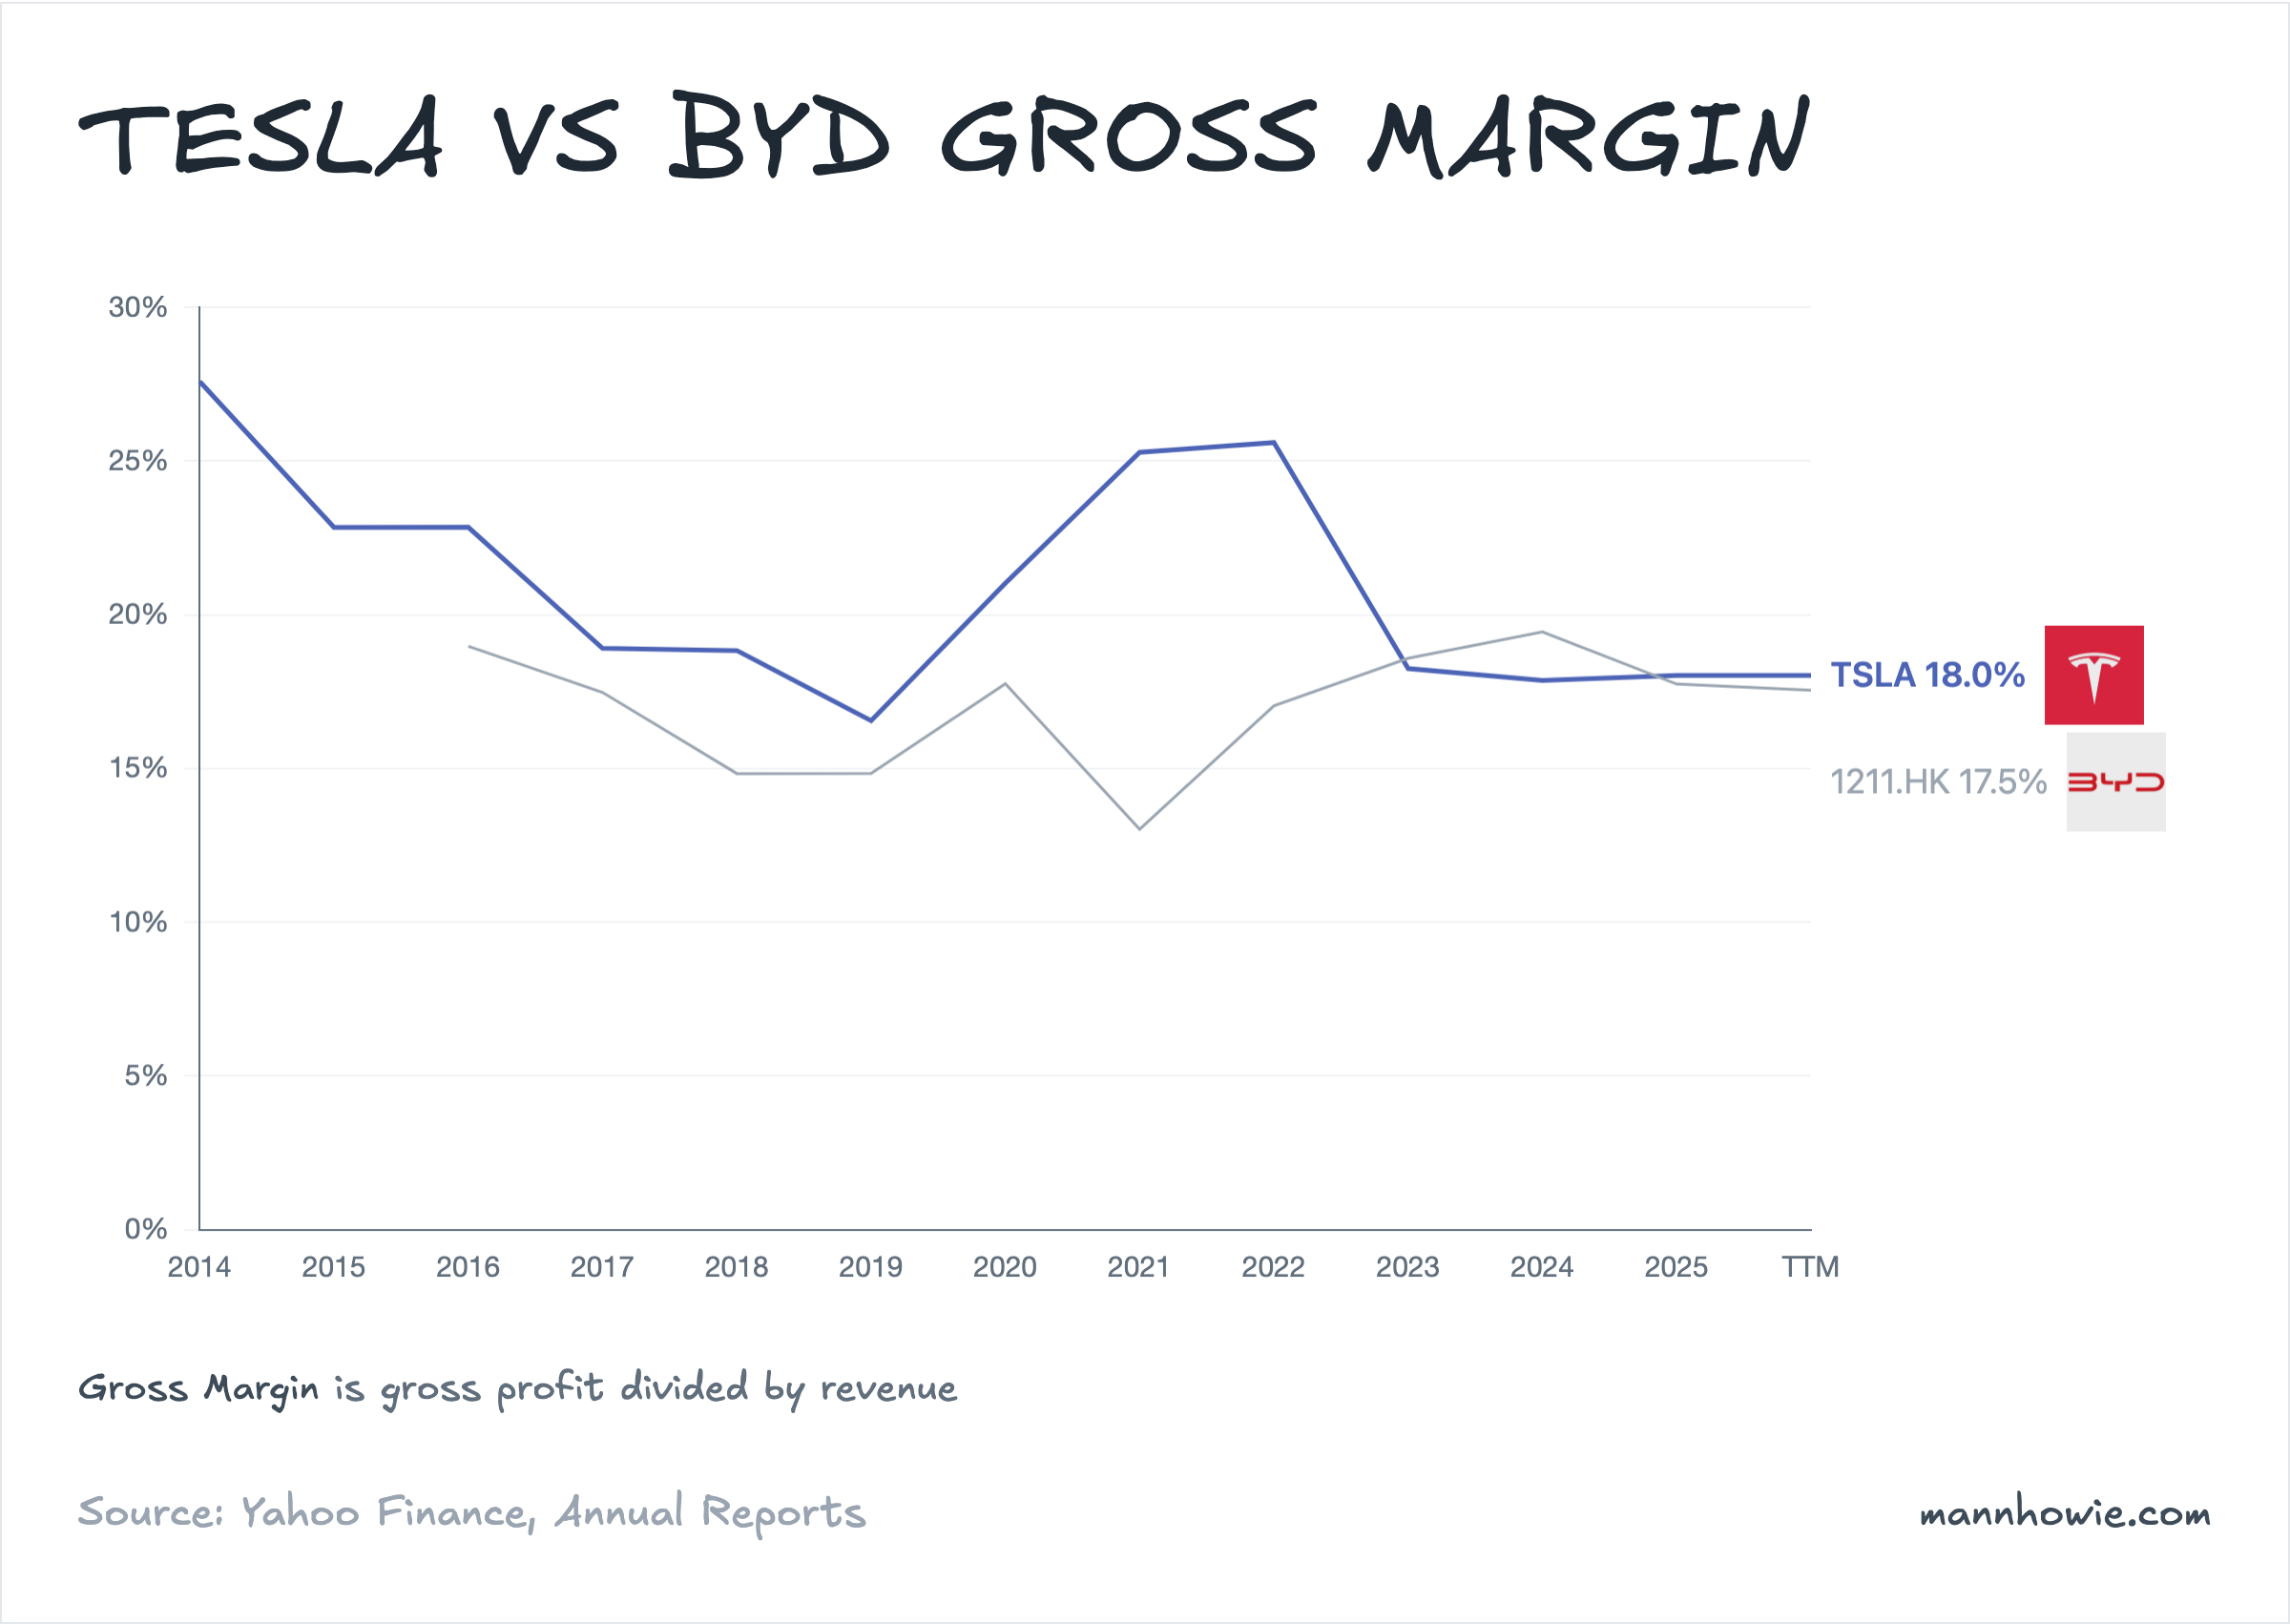
Tesla’s gross margin peaked at 25.6% in FY2022 and has slid to 18.0% under four years of price cuts. BYD’s has held steady at 17-19% while selling the Seagull hatchback for under $8,000. Unit costs fell as fast as prices did, a function of its in-house battery and semiconductor supply chain.
Inside Tesla’s numbers, automotive gross profit fell from $20.6B to $13.3B while Energy storage grew thirteen-fold to $3.8B on Megapack demand. Chinese competition compressed Tesla’s core profit pool; Energy absorbed part of the impact.
The autonomy premium is the other pillar of the gap. BYD sells 4.27 million vehicles a year, already built. Tesla sells investors volume that doesn’t yet exist.
“We expect to have fully autonomous vehicles in probably somewhere between a quarter and half of the United States by the end of the year, pending regulatory approval… We would expect over time to make far more CyberCabs than all of our other vehicles combined.”
— Elon Musk, Tesla Q4 FY2025 earnings call
CyberCab reframes Tesla from car OEM to autonomy-fleet operator. If unsupervised Full Self-Driving scales across a quarter to half of the US within a year, Tesla earns a per-mile software economic that no other automaker currently earns. If it does not, Tesla is a $95B automaker with a shrinking core margin and a $1.47T market cap. The spread between BYD at 24× P/E and Tesla at 388× is the probability-weighted value markets assign to those two outcomes.
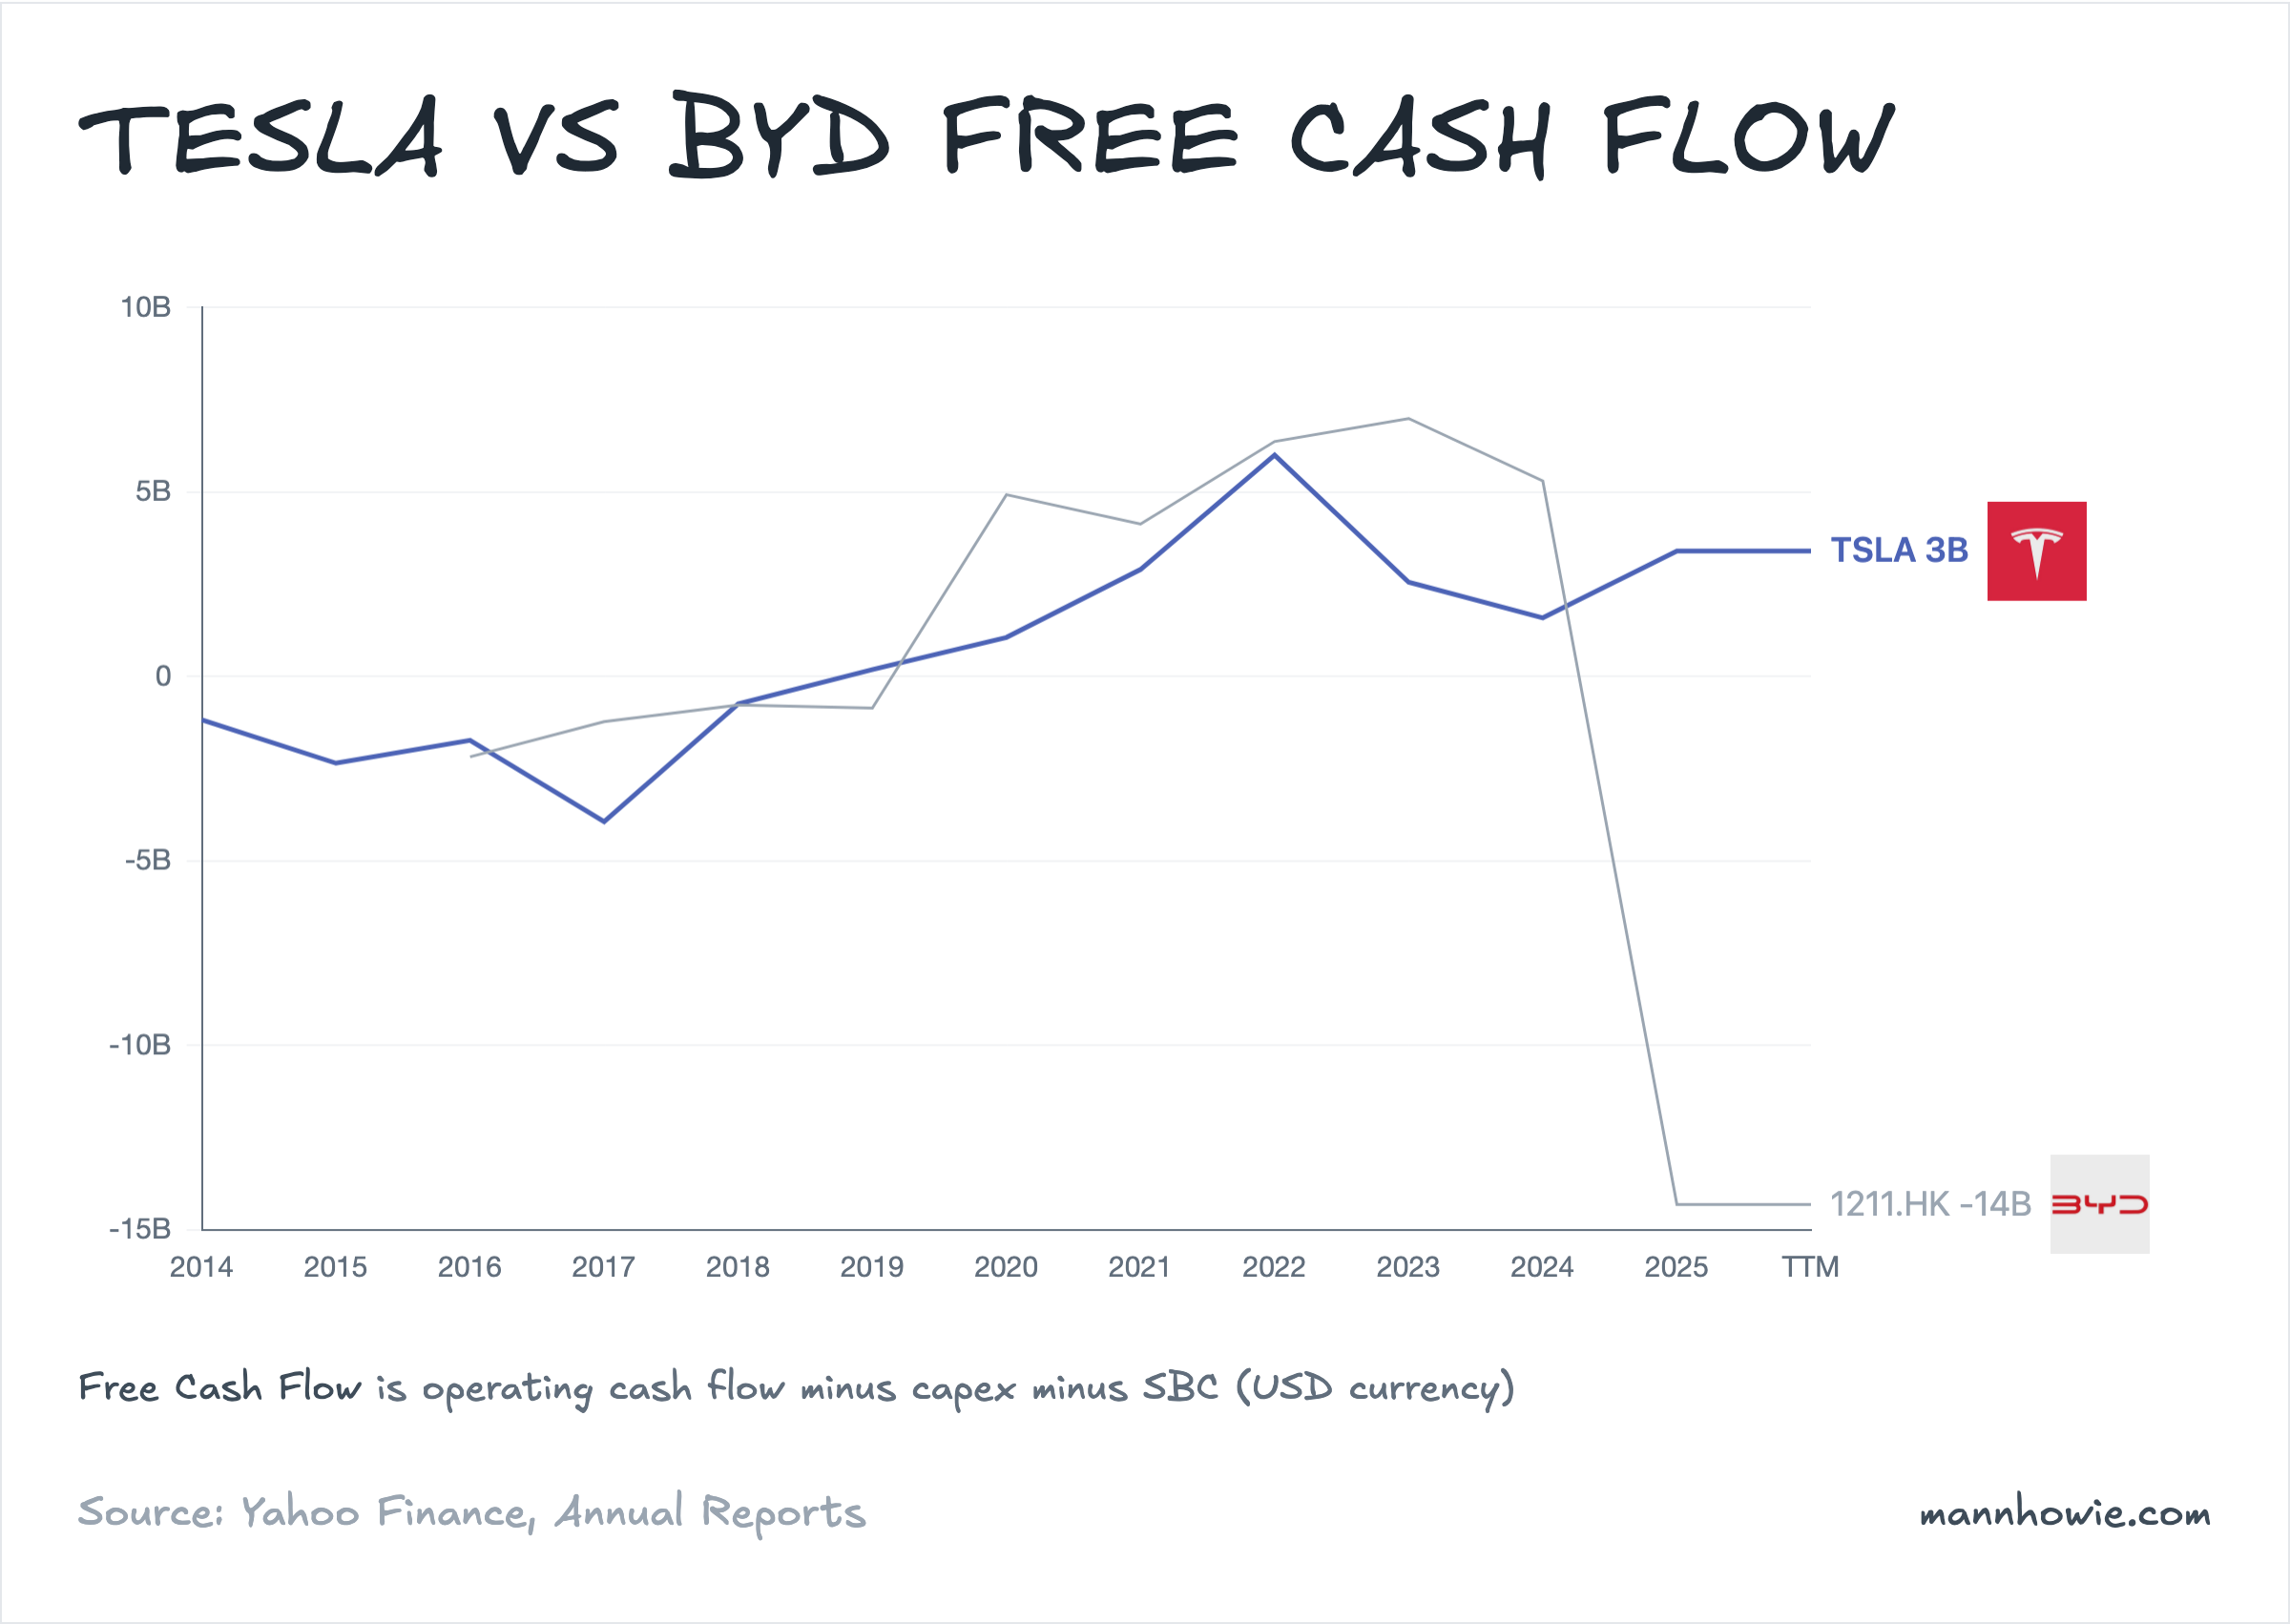
Capex and free cash flow
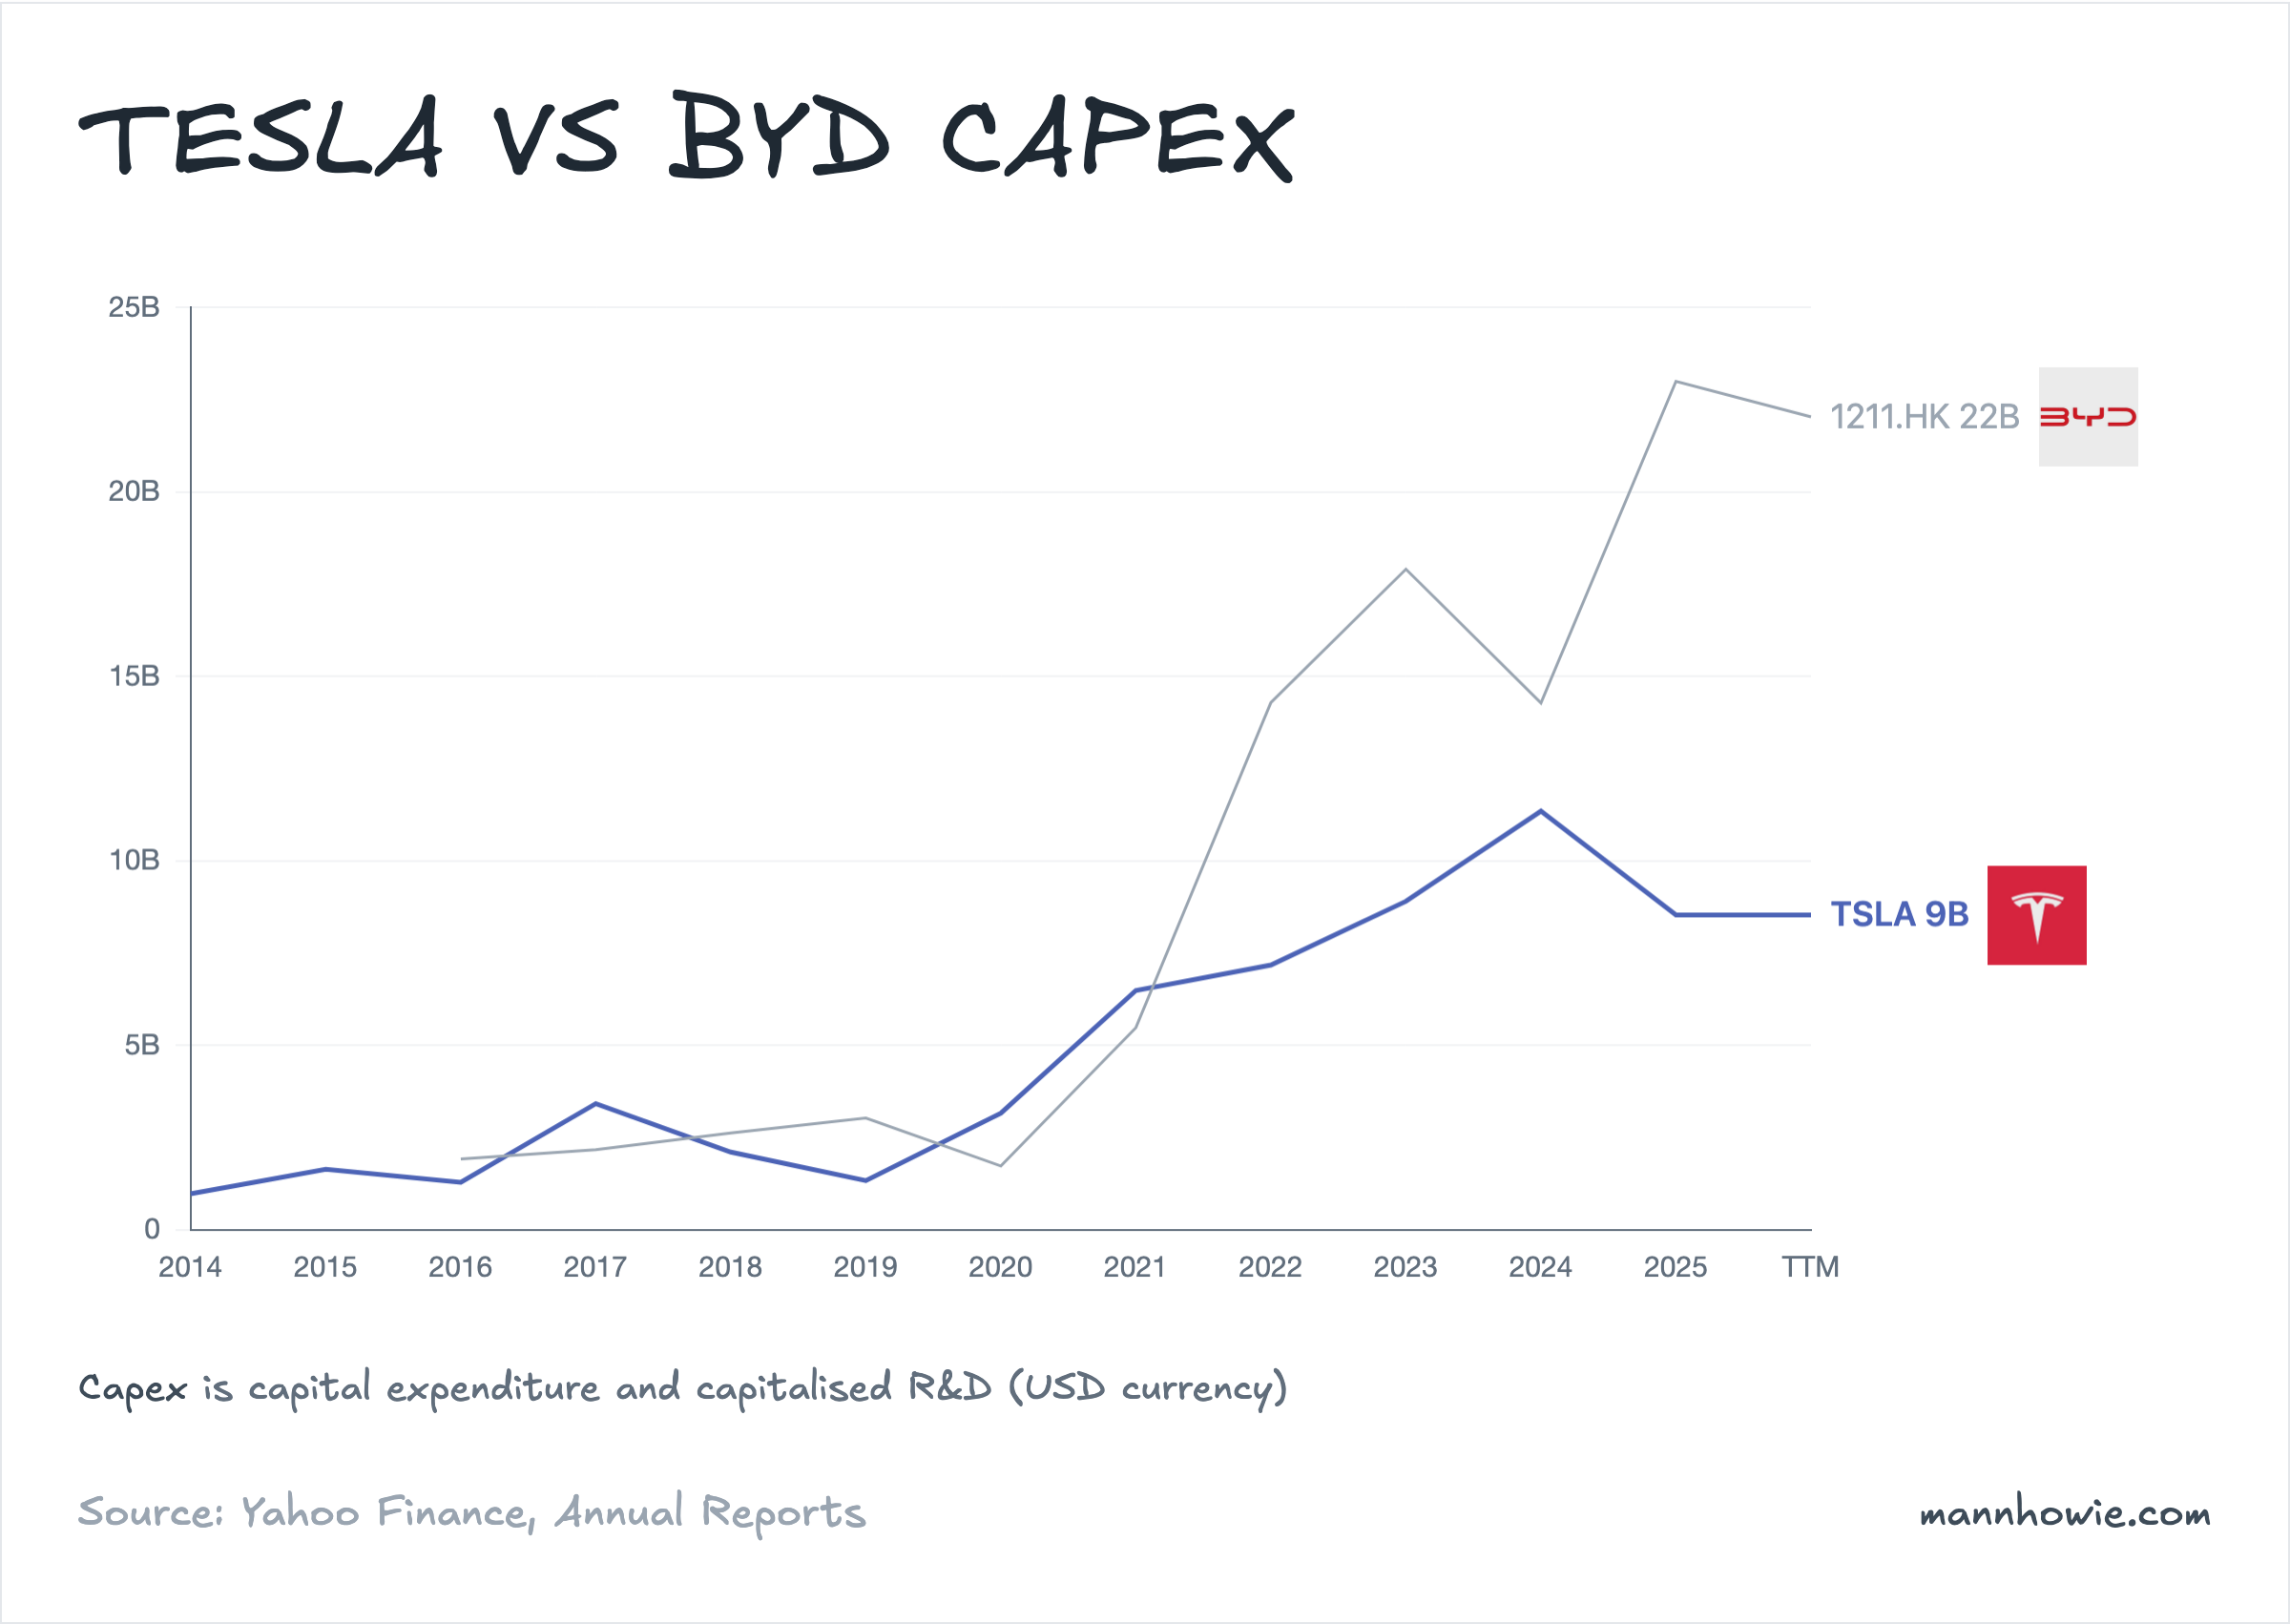
The two companies have inverted capital profiles. Tesla generated $3.4B of free cash flow in FY2025 and finished with $44B in cash. BYD burned $14.3B on $23.0B of capex to fund expansion.
| FCF (USD M) | Tesla | BYD |
|---|---|---|
| FY2022 | 5,992 | 6,361 |
| FY2023 | 2,545 | 6,984 |
| FY2024 | 1,582 | 5,292 |
| FY2025 | 3,395 | -14,320 |
BYD is reinvesting every dollar in new plants across Zhengzhou, Xi’an, Thailand and Brazil. Long-term borrowings jumped from $1.2B to $9.6B in a year to fund the build-out.
Tesla is guiding more than $20B of capex in FY2026 across six new sites, including the CyberCab line in Austin and the Optimus factory at Fremont, where Musk has set a million-units-a-year long-term target. The $44B cash position funds it internally.
Sources
- Tesla 10-K FY2025, pages 50, 93 (consolidated statements of operations, Note 16 Segment Reporting).
- Tesla 10-K FY2023, page 50, 92 (FY2022 comparatives, Note 18 Segment Reporting).
- BYD Company Limited 2024 Annual Report, pages 16, 352-356 (Chairman’s Statement, Note XVI Operating Segment Information, FY2024 and FY2023).
- BYD Company Limited 2022 Annual Report, pages 331-335 (Note XIV Operating Segment Information, FY2022 and FY2021 restated).
- Tesla Q3 2025 Earnings Call, October 2025, Q&A with Dan Meir Levy (Optimus “infinite money glitch” framing).
- Tesla Q4 2025 Earnings Call, 28 January 2026, prepared remarks and Q&A by Elon Musk (CyberCab volume commitment, unsupervised autonomy geographic rollout, Fremont Optimus conversion, FY2026 capex guidance).