Apple vs Samsung: the services engine and the memory-cycle swing
11 minute read | Mar 20, 2026 | Reviewed by Howie Mann
Apple designs iPhones, Macs, iPads and wearables, and runs a services platform (App Store, advertising, cloud, AppleCare, Apple Music, Apple TV+, Apple Pay) on top of the installed base. iPhone supplies half of revenue and Services a quarter, with the remainder split across Mac, iPad and Wearables, Home & Accessories.
Samsung Electronics runs two large operating divisions: Device eXperience (Galaxy smartphones, TVs, home appliances, networks) and Device Solutions (DRAM, NAND, System LSI, Foundry semiconductors). DX supplies 56% of revenue and DS 39%, with Samsung Display (majority-owned OLED panels) and Harman (connected-car audio) rounding out the group.
Revenue
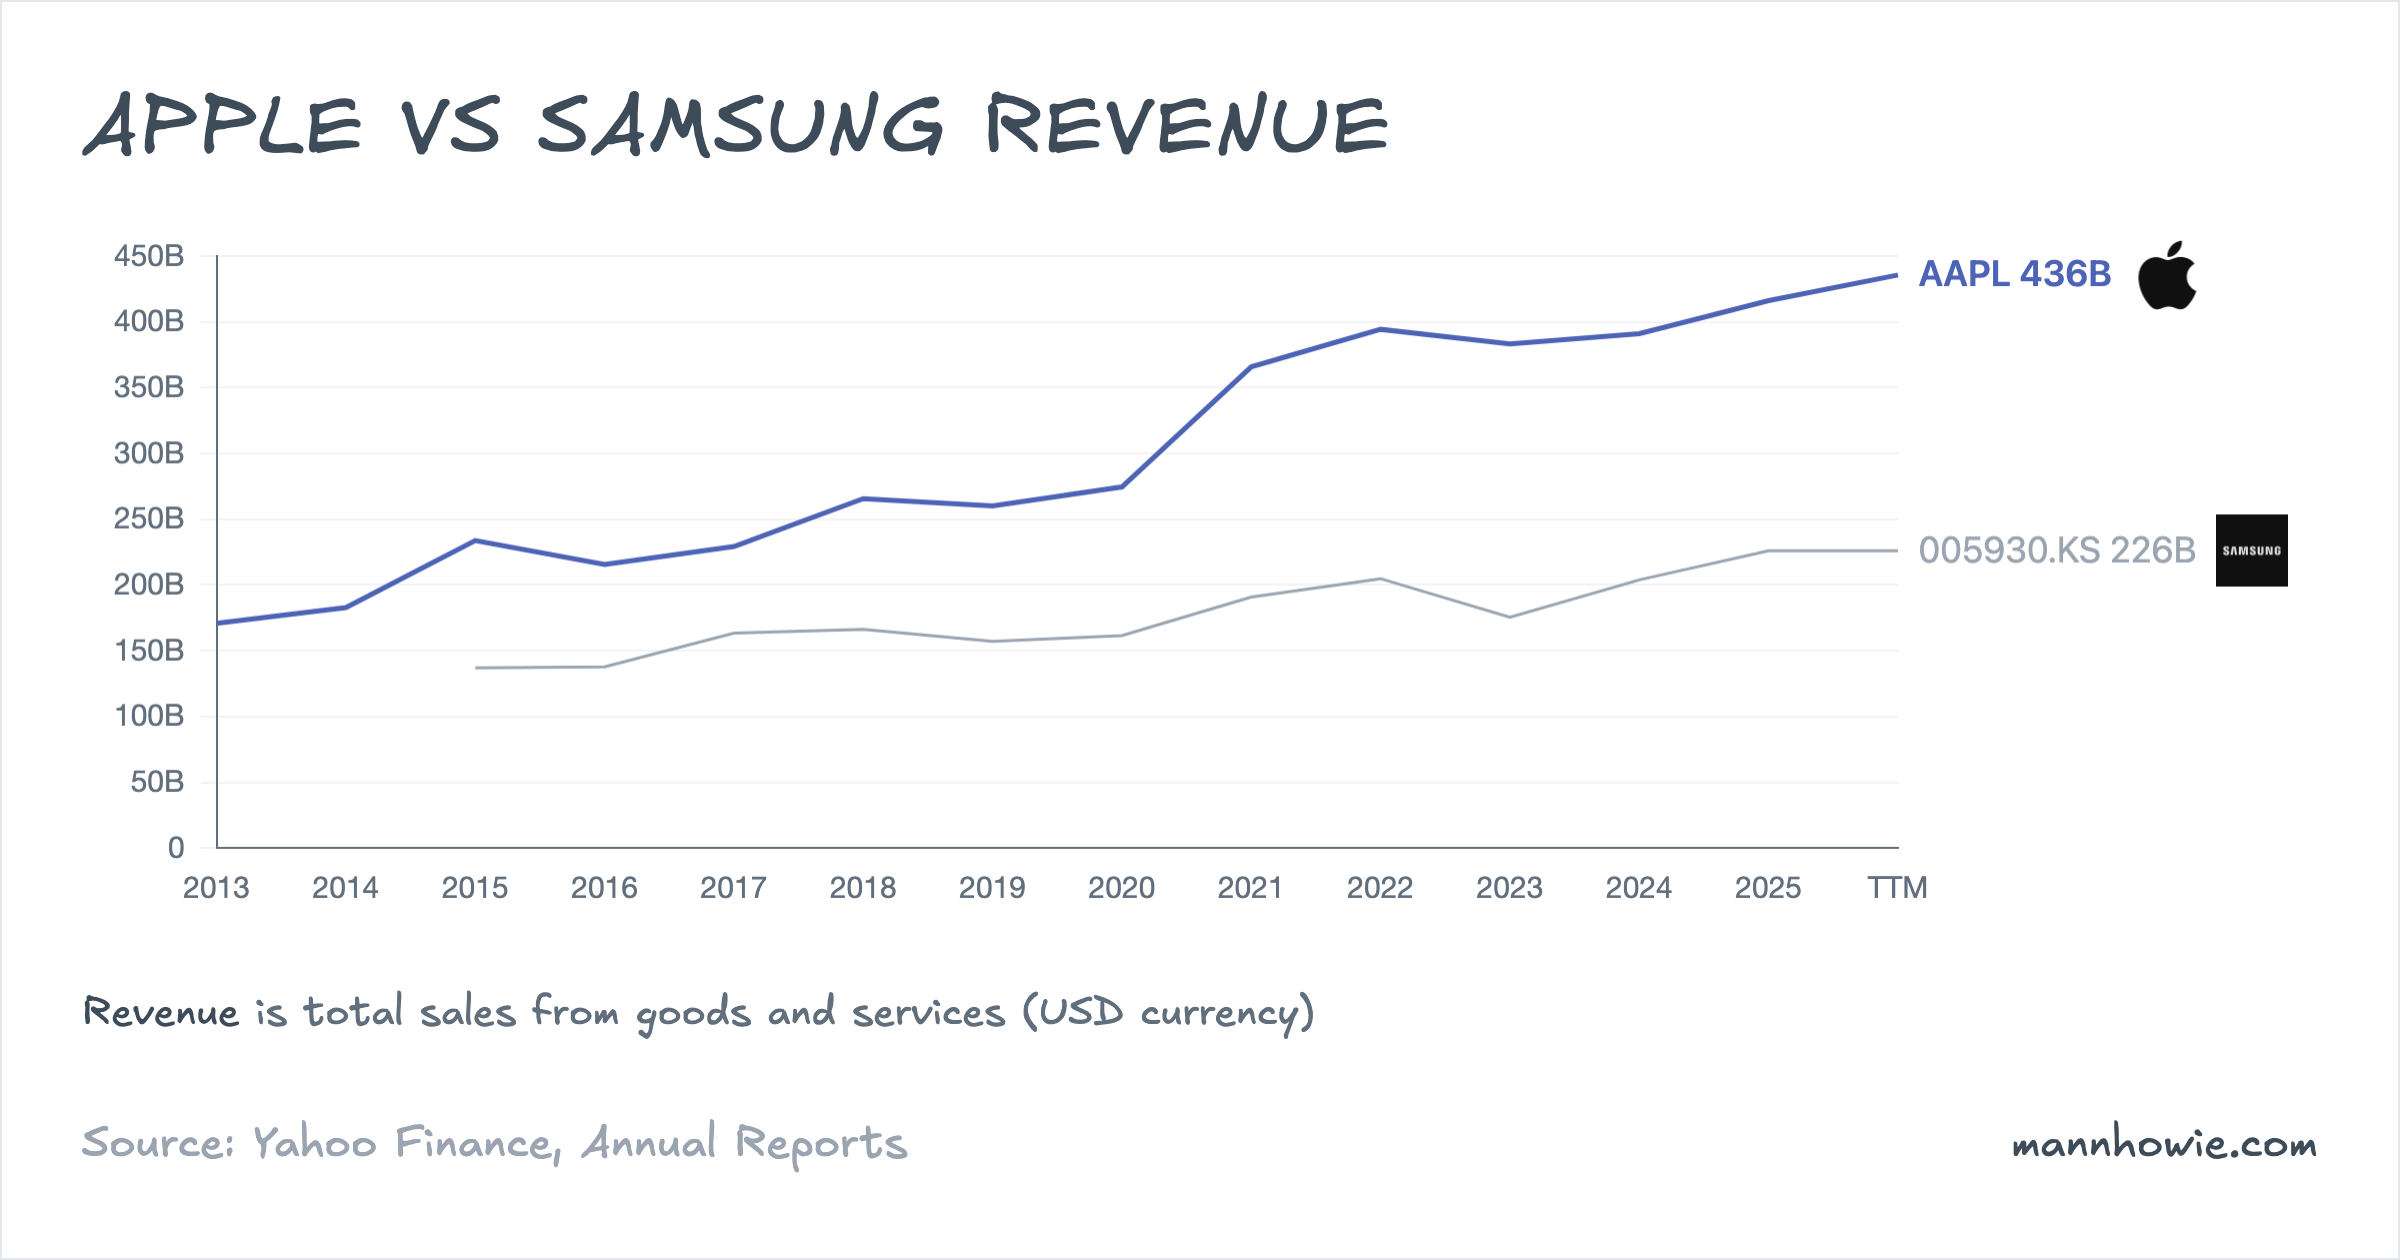
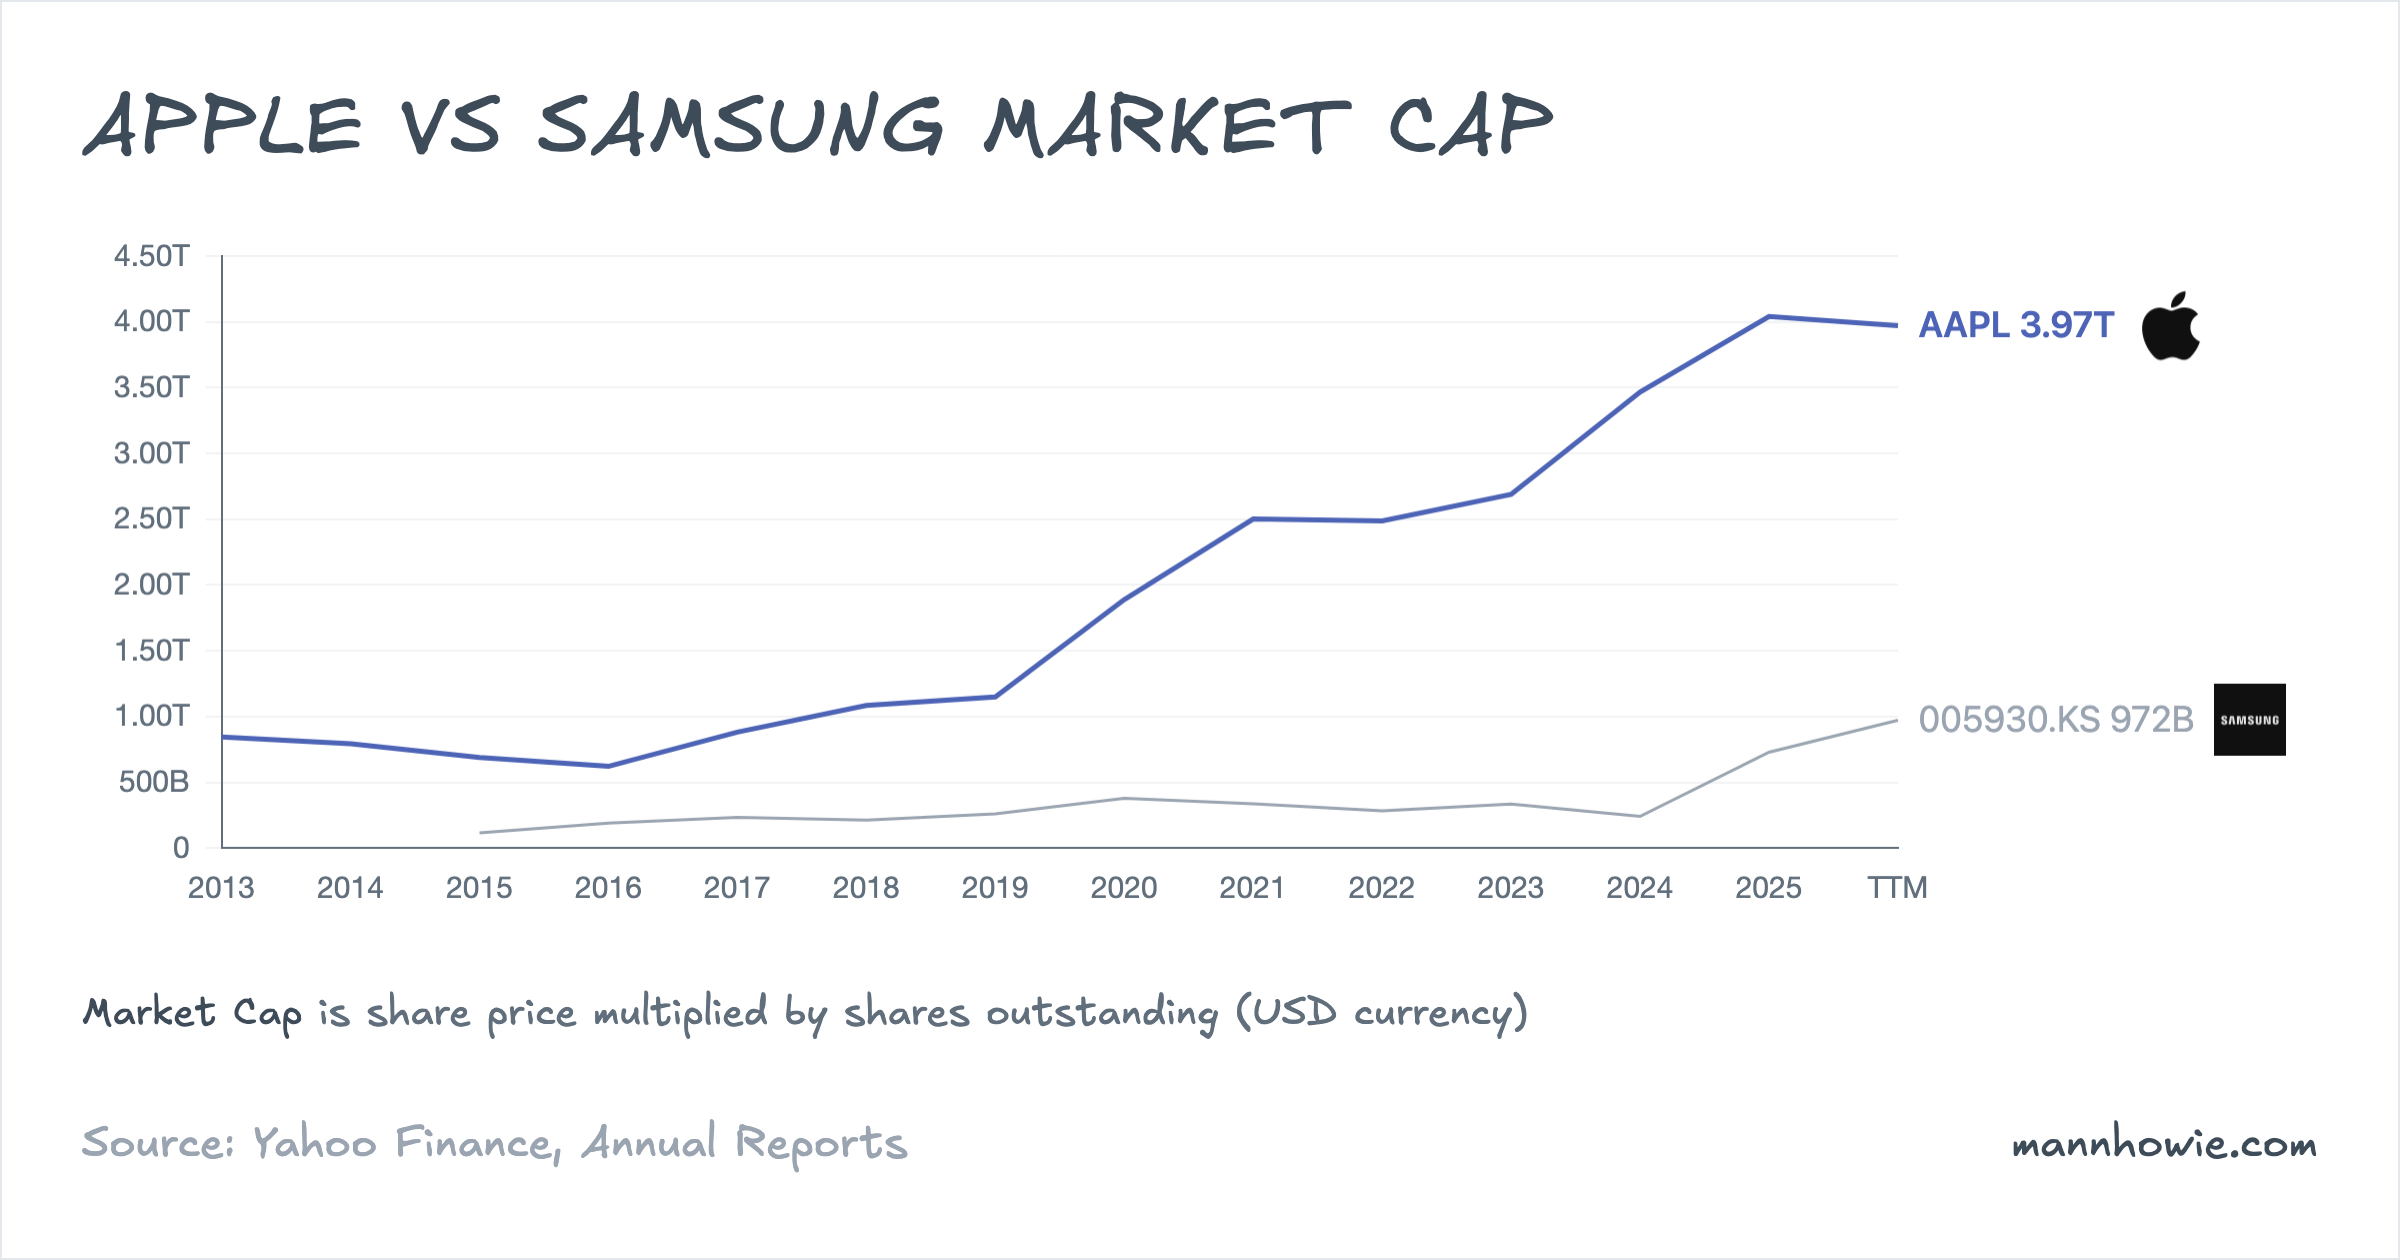
Over three years the two companies added almost identical revenue in dollars. Apple added $21.8B to reach net sales of $416.2B in FY2025. Samsung added $21.3B to reach revenue of $226.0B. Apple is roughly 1.8 times Samsung’s size and grew at a 2% compound annual rate against Samsung’s 3% (Samsung’s figure distorted by a memory-cycle trough in FY2023, when revenue fell to $175.4B). What matters is what drove the growth. At Apple, Services. At Samsung, memory.
Apple: net sales by product category
Apple reports net sales by category and geographic segment.
| Category (USD M) | FY2022 | FY2023 | FY2024 | FY2025 | % of FY25 | 3Y CAGR | 3Y Change ($) |
|---|---|---|---|---|---|---|---|
| iPhone | 205,489 | 200,583 | 201,183 | 209,586 | 50.4% | 1% | +4,097 |
| Services | 78,129 | 85,200 | 96,169 | 109,158 | 26.2% | 12% | +31,029 |
| Wearables, Home & Accessories | 41,241 | 39,845 | 37,005 | 35,686 | 8.6% | -5% | -5,555 |
| Mac | 40,177 | 29,357 | 29,984 | 33,708 | 8.1% | -6% | -6,469 |
| iPad | 29,292 | 28,300 | 26,694 | 28,023 | 6.7% | -1% | -1,269 |
| Total net sales | 394,328 | 383,285 | 391,035 | 416,161 | 100% | 2% | +21,833 |
Services added $31.0B at a 12% compound annual rate. That is more dollars than group revenue grew ($21.8B), because Mac, Wearables and iPad all contracted. Mac and Wearables each shed roughly $6B from their FY2022 peaks as the pandemic-era refresh cycle unwound. iPhone was flat in dollars and slipped from 52% to 50% of group revenue.
The mechanism is margin. Services gross margin reached 75.4% in FY2025 against Products gross margin of 36.8%. Services rose from 33% of group gross profit in FY2022 to 42% in FY2025 while its share of sales rose only from 20% to 26%. The 10-K does not size individual Services lines, but the FY2025 MD&A attributes growth “primarily to higher net sales from advertising, the App Store and cloud services”.
Tariffs are the material disclosed risk to the Products side. Apple names China mainland, India, Japan, South Korea, Taiwan and Vietnam as its primary outsourced manufacturing locations.
“Beginning in the second quarter of 2025, new U.S. Tariffs were announced, including additional tariffs on imports from China, India, Japan, South Korea, Taiwan, Vietnam and the EU, among others… Tariffs and other measures that are applied to the Company’s products or their components can have a material adverse impact on the Company’s business, results of operations and financial condition, including impacting the Company’s supply chain, the availability of rare earths and other raw materials and components, pricing and gross margin.”
— Apple 10-K FY2025, Item 7 MD&A, page 22
Samsung: revenue by reportable segment
Samsung reports revenue and operating profit across four reportable segments.
| Segment (USD M) | FY2022 | FY2023 | FY2024 | FY2025 | % of FY25 | 3Y CAGR | 3Y Change ($) |
|---|---|---|---|---|---|---|---|
| Device eXperience (DX) | 123,648 | 115,180 | 118,497 | 127,360 | 56.3% | 1% | +3,712 |
| Device Solutions (DS) | 66,709 | 45,122 | 75,254 | 88,170 | 39.0% | 10% | +21,461 |
| Samsung Display (SDC) | 23,296 | 20,988 | 19,756 | 20,220 | 8.9% | -5% | -3,077 |
| Harman | 8,953 | 9,749 | 9,672 | 10,694 | 4.7% | 6% | +1,741 |
| Intercompany eliminations | (17,827) | (15,594) | (19,321) | (20,405) | — | — | — |
| Total revenue | 204,780 | 175,445 | 203,859 | 226,039 | 100% | 3% | +21,259 |
DX was the largest segment at 56% of FY2025 revenue but essentially flat, adding $3.7B at a 1% compound annual rate. DS was the driver. It added $21.5B at 10% compound annual, which covers essentially all of group revenue growth. Samsung Display fell $3.1B as mobile-OLED pricing compressed.
Samsung also discloses revenue by four product groupings, which pinpoints where inside DS the growth came from:
| Product line (USD M) | FY2022 | FY2023 | FY2024 | FY2025 | 3Y CAGR | 3Y Change ($) |
|---|---|---|---|---|---|---|
| Smartphone and other (within DX) | 78,208 | 73,605 | 77,530 | 85,694 | 3% | +7,487 |
| Memory (within DS) | 46,437 | 29,898 | 57,229 | 70,522 | 15% | +24,085 |
| TV, monitor and other (within DX) | 22,549 | 20,581 | 20,958 | 20,910 | -2% | -1,639 |
| Display panels (SDC) | 23,296 | 20,988 | 19,756 | 20,220 | -5% | -3,077 |
Memory revenue grew from $46.4B to $70.5B over three years, an increase of $24.1B at a 15% compound annual rate. That product line alone added more dollars than every other Samsung product group combined. The mechanism is the ramp of high-bandwidth memory (HBM) stacked DRAM, used alongside GPUs in AI training systems, together with a cyclical recovery in mainstream DRAM and NAND pricing after the FY2023 trough.
EBIT and margins
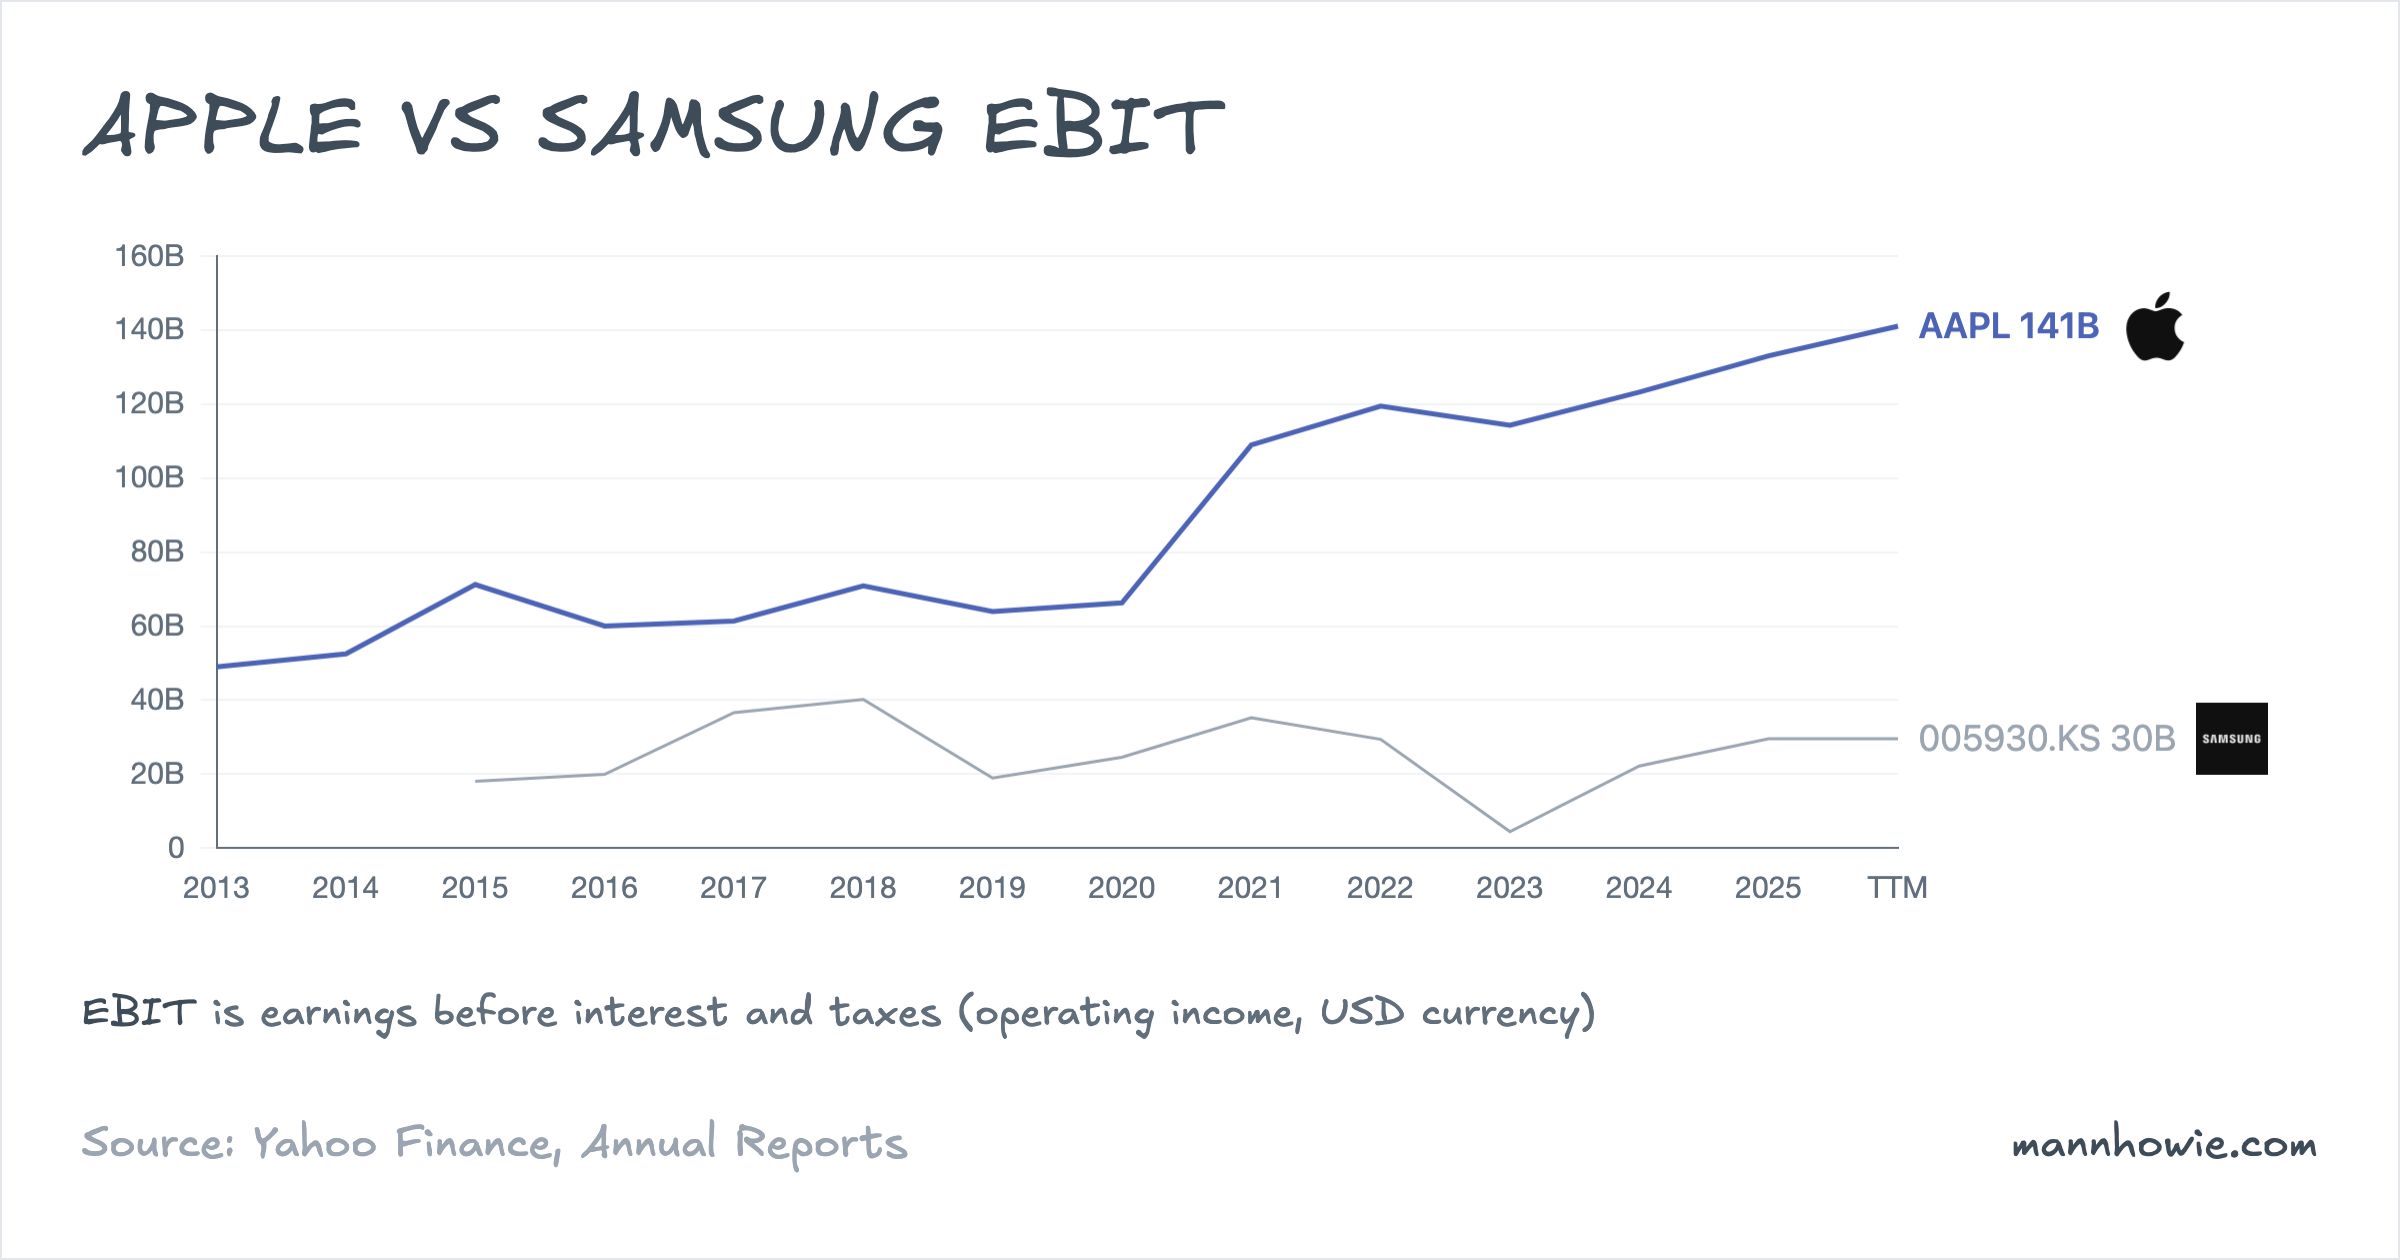
Apple produces roughly 4.5 times Samsung’s operating income on 1.8 times the revenue, and at a structurally higher and more stable margin.
| Consolidated operating margin | FY2022 | FY2023 | FY2024 | FY2025 |
|---|---|---|---|---|
| Apple | 30.3% | 29.8% | 31.5% | 32.0% |
| Samsung | 14.4% | 2.5% | 10.9% | 13.1% |
Apple’s margin has ground up 1.7 percentage points over three years to reach $133.1B of operating income on $416.2B of sales. Samsung’s margin passed through a memory-cycle trough in FY2023, where group operating profit collapsed to $4.5B (85% down year on year) before recovering to $29.5B on $226.0B of revenue. The mechanism behind each trajectory is segment mix: for Apple, the rising share of Services; for Samsung, the swing in Device Solutions.
Apple: profit by geography, margin by mix
Apple does not disclose operating income by product line. It reports it on a geographic basis, before unallocated R&D and other corporate costs.
| Segment (USD M) | FY2022 | FY2023 | FY2024 | FY2025 | % of FY25 | 3Y CAGR | 3Y Change ($) |
|---|---|---|---|---|---|---|---|
| Americas | 62,683 | 60,508 | 67,656 | 72,480 | 41.3% | 5% | +9,797 |
| Europe | 35,233 | 36,098 | 41,790 | 47,739 | 27.2% | 11% | +12,506 |
| Greater China | 31,153 | 30,328 | 27,082 | 26,917 | 15.3% | -5% | -4,236 |
| Rest of Asia Pacific | 11,569 | 12,066 | 13,062 | 14,586 | 8.3% | 8% | +3,017 |
| Japan | 12,257 | 11,888 | 12,454 | 13,955 | 7.9% | 4% | +1,698 |
| Total segment operating income | 152,895 | 150,888 | 162,044 | 175,677 | 100% | 5% | +22,782 |
| Less: R&D and unallocated expenses | (33,458) | (36,587) | (38,828) | (42,627) | — | — | — |
| Consolidated operating income | 119,437 | 114,301 | 123,216 | 133,050 | — | 4% | +13,613 |
The Americas carries 41% of segment operating income. Europe was the biggest absolute contributor (+$12.5B) and fastest grower (11% compound annual); Greater China moved the other way and fell $4.2B. Unallocated R&D and other corporate expenses grew from $33.5B to $42.6B (8% compound annual), which is why consolidated operating income grew 4% while segment operating income grew 5%.
The margin lever sits outside this table. Services reached 26% of sales and produced 42% of group gross profit in FY2025, on a 75.4% gross margin against 36.8% on Products. Each dollar of Services revenue contributes roughly twice the gross profit of a dollar of hardware. That mix shift is the mechanism behind the 1.7-point lift in consolidated operating margin, partly offset by R&D and corporate expense rising faster than revenue.
Samsung: DS margin swings the group
Samsung’s segment margins show that the group margin is essentially the DS margin with three smaller lines averaged on top.
| Segment operating margin | FY2022 | FY2023 | FY2024 | FY2025 | FY25 op. profit (USD M) |
|---|---|---|---|---|---|
| Device Solutions (DS) | 24.2% | -22.3% | 13.6% | 19.1% | 16,843 |
| Device eXperience (DX) | 7.0% | 8.5% | 7.1% | 6.8% | 8,708 |
| Samsung Display (SDC) | 17.3% | 18.0% | 12.8% | 13.8% | 2,789 |
| Harman | 6.7% | 8.2% | 9.2% | 9.7% | 1,037 |
| Group | 14.4% | 2.5% | 10.9% | 13.1% | 29,542 |
DS produced 57% of segment operating profit in FY2025 ($16.8B) at a 19.1% margin — nearly three times DX’s 6.8% — and carries all of the group’s margin volatility. Its margin ran 24.2% → -22.3% → 13.6% → 19.1%, a 47-point peak-to-trough swing inside 12 months. DS lost $10.1B in FY2023 on DRAM and NAND price declines; the recovery to $16.8B is the HBM ramp and memory-cycle upturn visible in the product-line table above.
DX is Samsung’s largest segment by revenue (56%) but runs at a structurally thinner 7% operating margin and produced only 30% of segment operating profit. It generated essentially the same operating profit in FY2025 ($8.7B) as in FY2022 ($8.6B) on $3.7B more revenue, as component costs and smartphone competition compressed unit economics. Samsung Display’s margin fell from 17.3% to 13.8% on OLED-panel pricing pressure. Harman climbed from 6.7% to 9.7% off a small base.
DS carries almost all of the group’s capital stock. It recorded ₩38.0tn (roughly $25.7B) of depreciation in FY2025, or 87% of the group total, reflecting the memory fabs in Korea (Pyeongtaek, Hwaseong) and the under-construction logic foundry in Taylor, Texas. DX’s depreciation was ₩2.7tn ($1.8B), roughly one-fourteenth of DS. The same fab base produced a $10B loss in FY2023 and a $17B profit in FY2025: a $27B operating-profit swing on a largely fixed depreciation base. Group operating margin therefore moves with DS pricing, not with revenue mix.
Capex
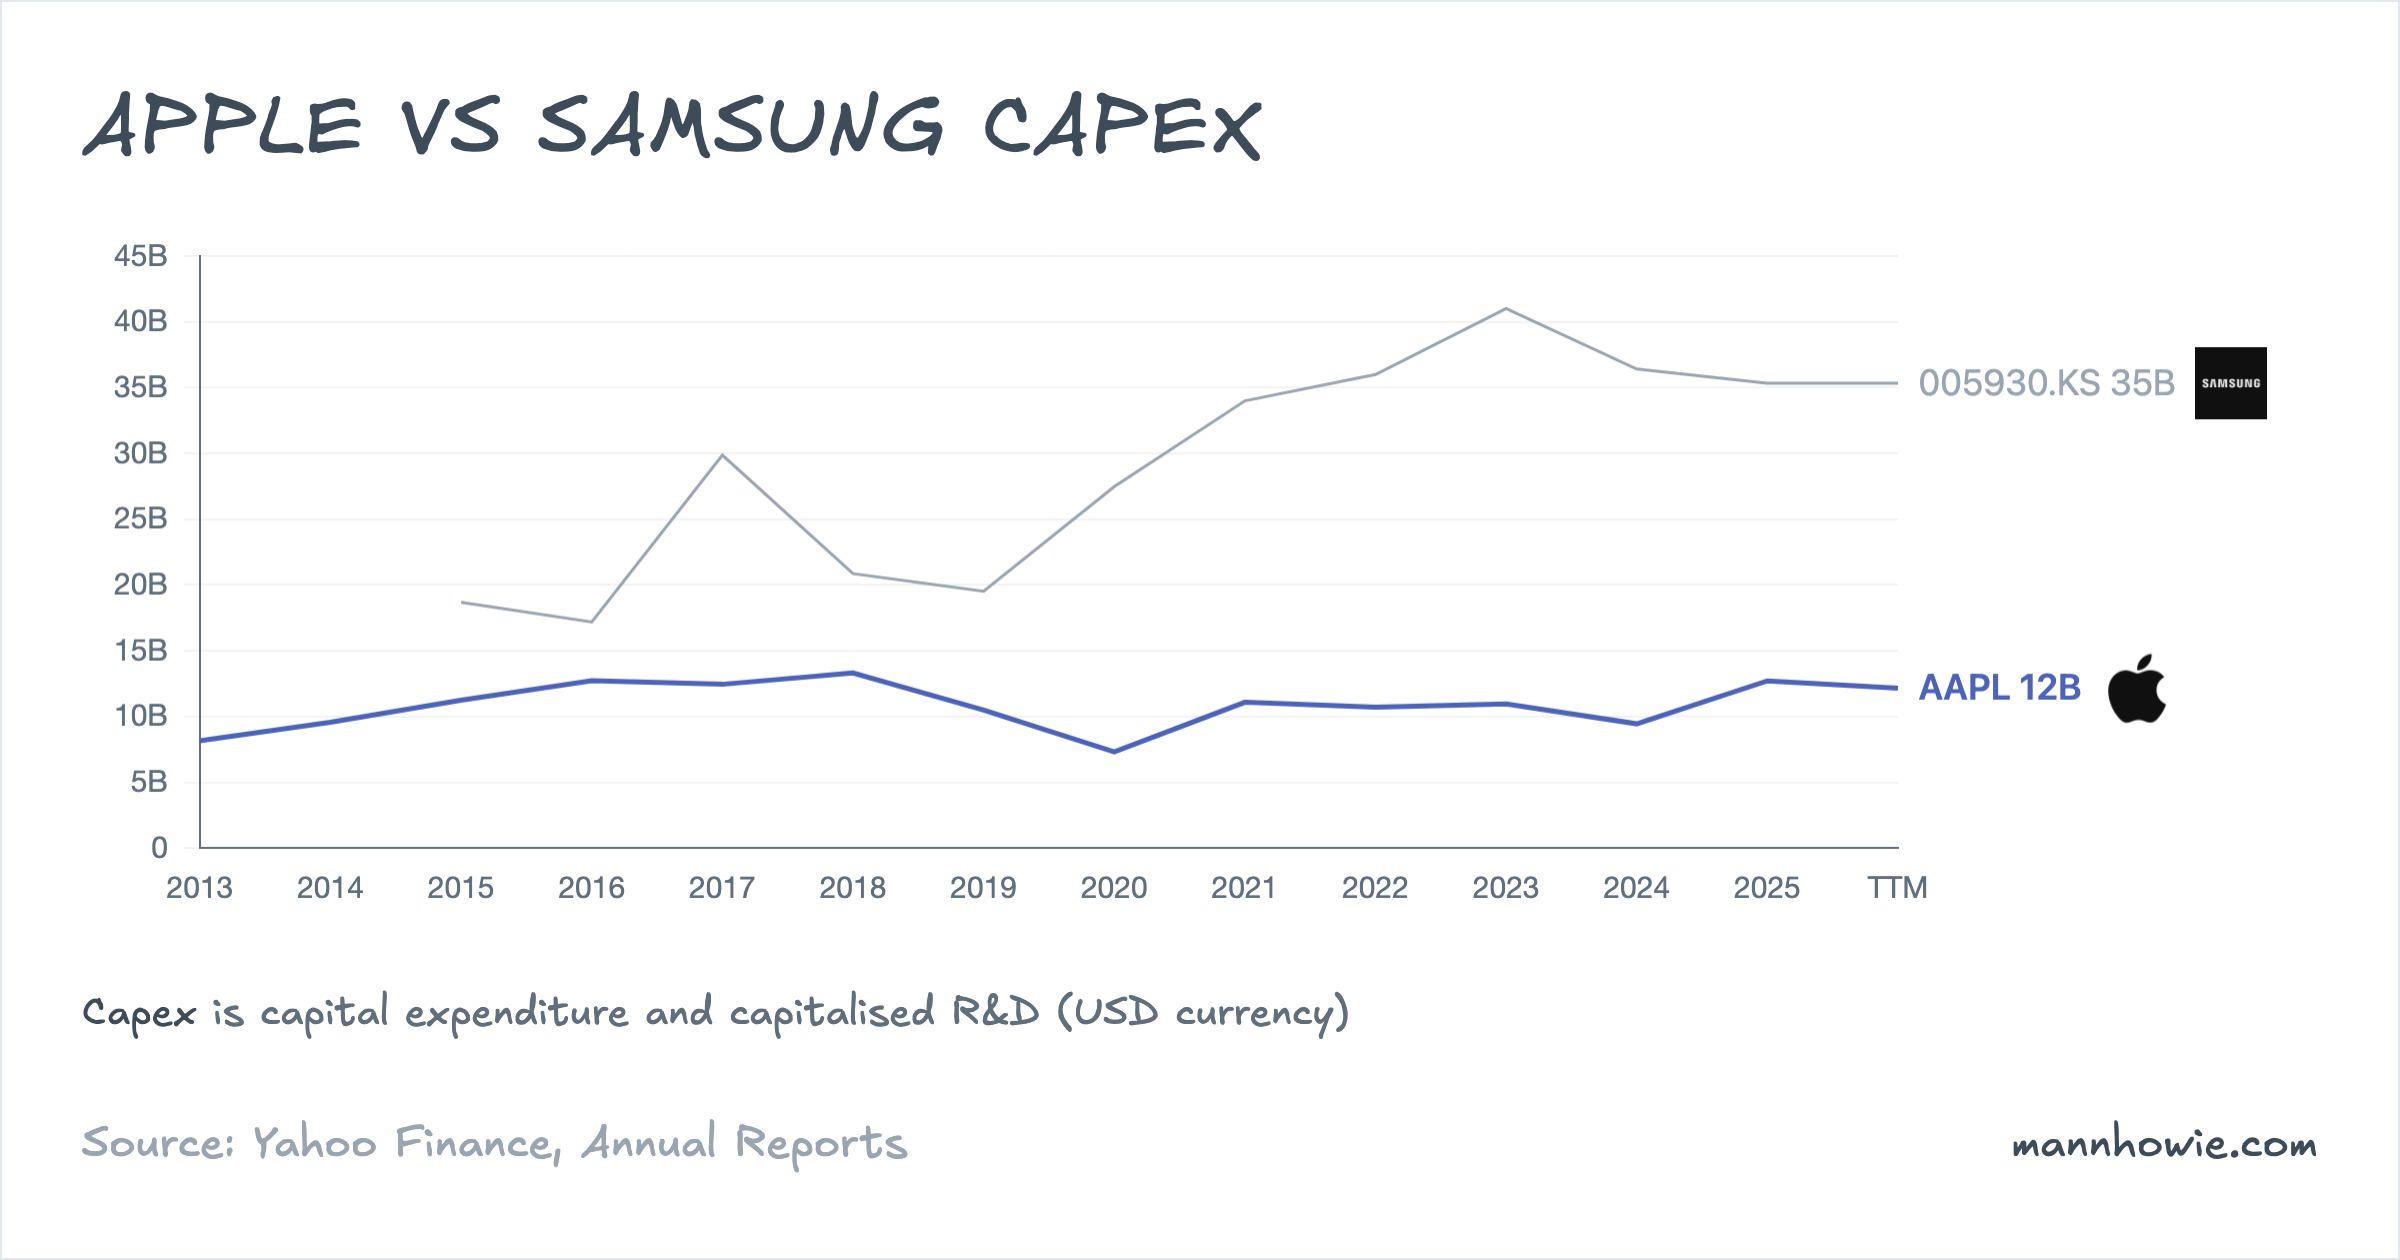
The capital-intensity gap is wide. Apple’s capital expenditure was $12.7B in FY2025 on revenue of $416.2B, or 3.1% of revenue. Samsung’s was $35.3B on $226.0B, or 15.6%. Over three years Apple has averaged $11.0B a year; Samsung has averaged $37.2B. Apple outsources silicon fabrication to TSMC and assembly to outsourced partners. Samsung owns both its fabs and its display plants. DS accounted for 87% of Samsung group depreciation in FY2025, confirming that memory and foundry capacity carry essentially all of the capital stock.
Apple’s capex has risen modestly, from $10.7B in FY2022 to $12.7B in FY2025 (+$2.0B). Samsung’s has run between $33.9B and $41.0B and peaked in FY2023 at $41.0B, at the bottom of the memory cycle. Samsung kept building next-node DRAM and HBM capacity through the downturn.
Sources
- Headline financials and chart data: finance.mannhowie.com/api/financials/AAPL and /005930.KS.
- Apple 10-K FY2025 (year ended 27 September 2025), pages 22 to 24 and Note 13 Segment Information, page 47.
- Apple 10-K FY2024 (year ended 28 September 2024), page 24 and Note 2 Revenue / Note 13 Segment Information, pages 35 and 47.
- Samsung Electronics Consolidated Audited Financial Statements FY2025 (year ended 31 December 2025), Note 30 Segment Information, pages 86 to 87.
- Samsung Electronics Consolidated Audited Financial Statements FY2024, Note 29 Segment Information, pages 79 to 80.
- Samsung Electronics Consolidated Audited Financial Statements FY2023, Note 29 Segment Information, pages 78 to 79.