Meta vs Alphabet: Ad Concentration, Margin Profiles and AI Capex
9 minute read | Apr 13, 2026 | Reviewed by Howie Mann
Meta operates Facebook, Instagram, Messenger and WhatsApp. Nearly all of its revenue comes from advertising across those apps, supplemented by a small hardware business in virtual and augmented reality headsets.
Alphabet runs Google Search, YouTube and a cloud computing platform. Revenue comes from search and YouTube ads, ads on third-party websites, Google Cloud fees and consumer subscriptions.
Revenue
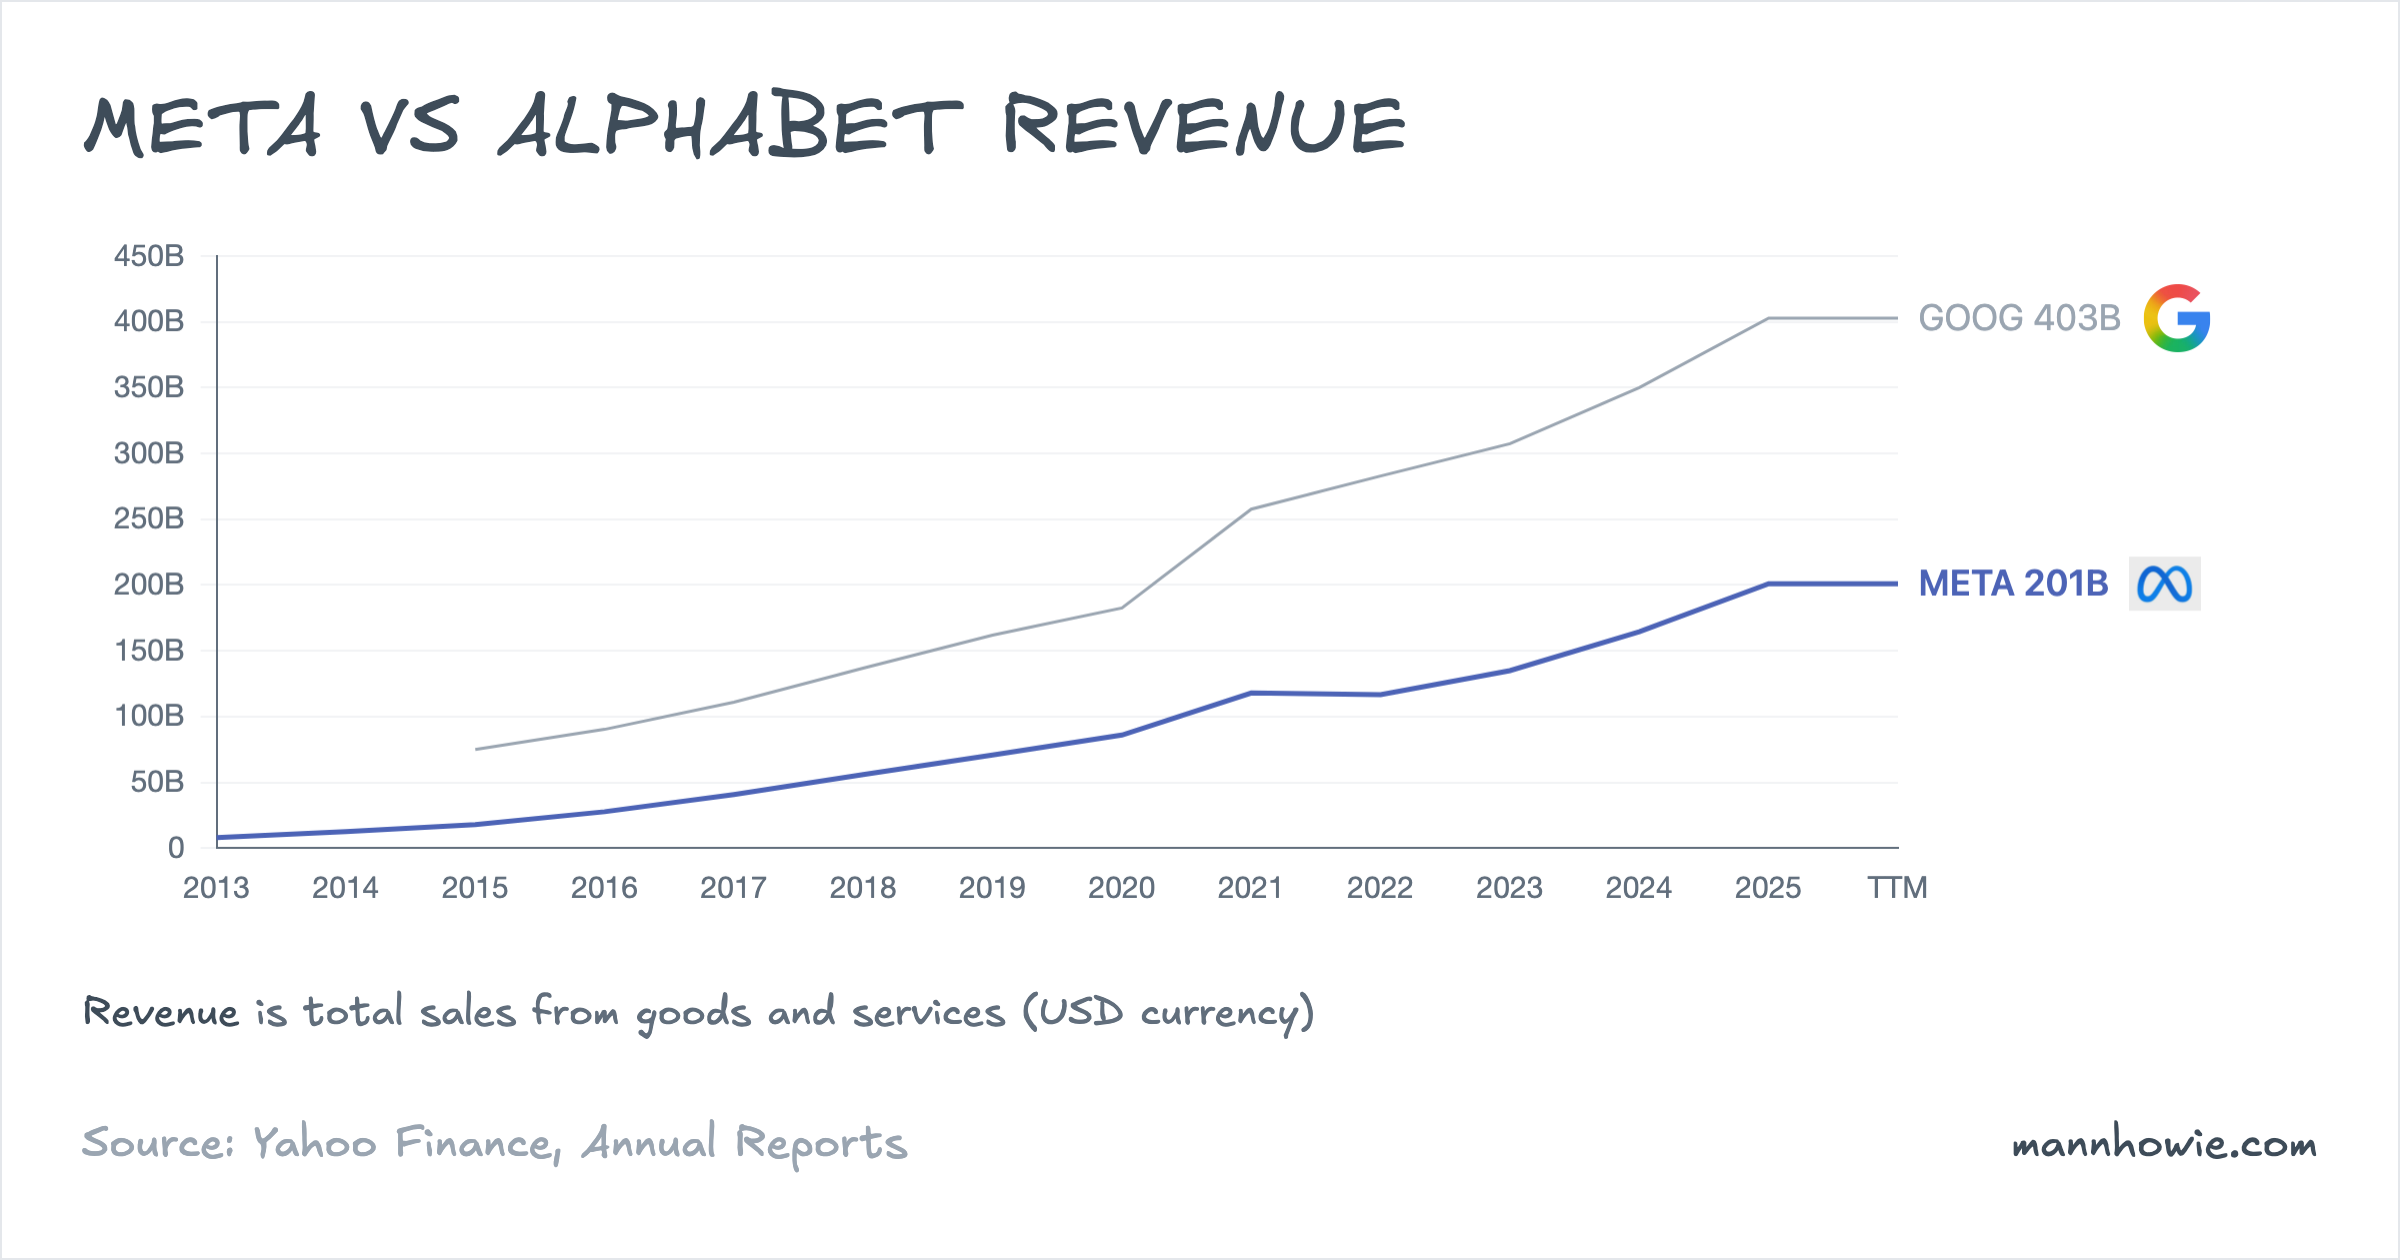
Alphabet’s revenue is roughly twice Meta’s. Between 2022 and 2025, Alphabet added $120B at a 12.5% compound annual rate on a $283B base. Meta grew faster at 19.9% and added $84B on a $117B base.
Both are advertising businesses. Meta derives 98% of its revenue from ads served on its own apps. Alphabet’s advertising lines (Search, YouTube ads, Google Network) account for 73%, with the remaining 27% from Google Cloud, subscriptions and hardware.
Meta: revenue by source
| Revenue source (USD M) | FY2022 | FY2023 | FY2024 | FY2025 | % of FY25 | 3Y CAGR | 3Y Change ($) |
|---|---|---|---|---|---|---|---|
| Advertising | 113,642 | 131,948 | 160,633 | 196,175 | 97.6% | 20.0% | +82,533 |
| Other (Family of Apps) | 808 | 1,058 | 1,722 | 2,584 | 1.3% | 47.3% | +1,776 |
| Reality Labs | 2,159 | 1,896 | 2,146 | 2,207 | 1.1% | 0.7% | +48 |
| Total | 116,609 | 134,902 | 164,501 | 200,966 | 100% | 19.9% | +84,357 |
Advertising accounts for 98% of revenue and drove 98% of the three-year increase. Ad revenue grew at a 20% compound annual rate on a $114B base, adding $83B. Reality Labs revenue was flat at roughly $2B, split between Quest headset sales and related services.
Meta’s advertising runs entirely on proprietary surfaces. It pays no traffic acquisition costs to third parties. That is the primary driver of the gross margin gap with Alphabet (82% versus 60%): Alphabet pays distribution partners to maintain search defaults and shares revenue with Google Network publishers. Meta’s ad base is now two-thirds the size of Alphabet’s total advertising revenue ($196B versus $295B). Three years ago it was roughly half. The narrowing reflects Meta’s investment in AI-driven ad targeting and Reels monetisation across Instagram and Facebook, expanding ad inventory without proportionally increasing costs.
Alphabet: revenue by product line
| Line item (USD M) | FY2022 | FY2023 | FY2024 | FY2025 | % of FY25 | 3Y CAGR | 3Y Change ($) |
|---|---|---|---|---|---|---|---|
| Google Search & other | 162,450 | 175,033 | 198,084 | 224,532 | 55.7% | 11.4% | +62,082 |
| Google Cloud | 26,280 | 33,088 | 43,229 | 58,705 | 14.6% | 30.8% | +32,425 |
| Subscriptions, platforms, devices | 29,055 | 34,688 | 40,340 | 48,030 | 11.9% | 18.2% | +18,975 |
| YouTube ads | 29,243 | 31,510 | 36,147 | 40,367 | 10.0% | 11.3% | +11,124 |
| Google Network | 32,780 | 31,312 | 30,359 | 29,792 | 7.4% | -3.1% | -2,988 |
| Other Bets | 1,068 | 1,527 | 1,648 | 1,537 | 0.4% | 12.9% | +469 |
| Hedging gains/(losses) | 1,960 | 236 | 211 | (127) | 0.0% | n/m | -2,087 |
| Total | 282,836 | 307,394 | 350,018 | 402,836 | 100% | 12.5% | +120,000 |
Google Search accounts for 56% of Alphabet’s revenue and added $62B over three years, the largest absolute increase. Google Cloud is the fastest-growing line at 31% compound annual, adding $32B on a $26B base. Google Network, which places ads on third-party websites, is the only line in decline.
Alphabet’s combined advertising revenue (Search, YouTube ads and Network) grew at 9.5% compound annual, adding $70B. Meta’s advertising grew at 20% and added $83B. In absolute dollar terms, Meta added more ad revenue over three years despite starting from a smaller base.
EBIT and margins
Alphabet earns more in absolute operating profit. Meta converts revenue to profit at a higher rate.
| Metric (TTM) | Meta | Alphabet | Gap |
|---|---|---|---|
| Revenue | $201.0B | $402.8B | GOOG +100% |
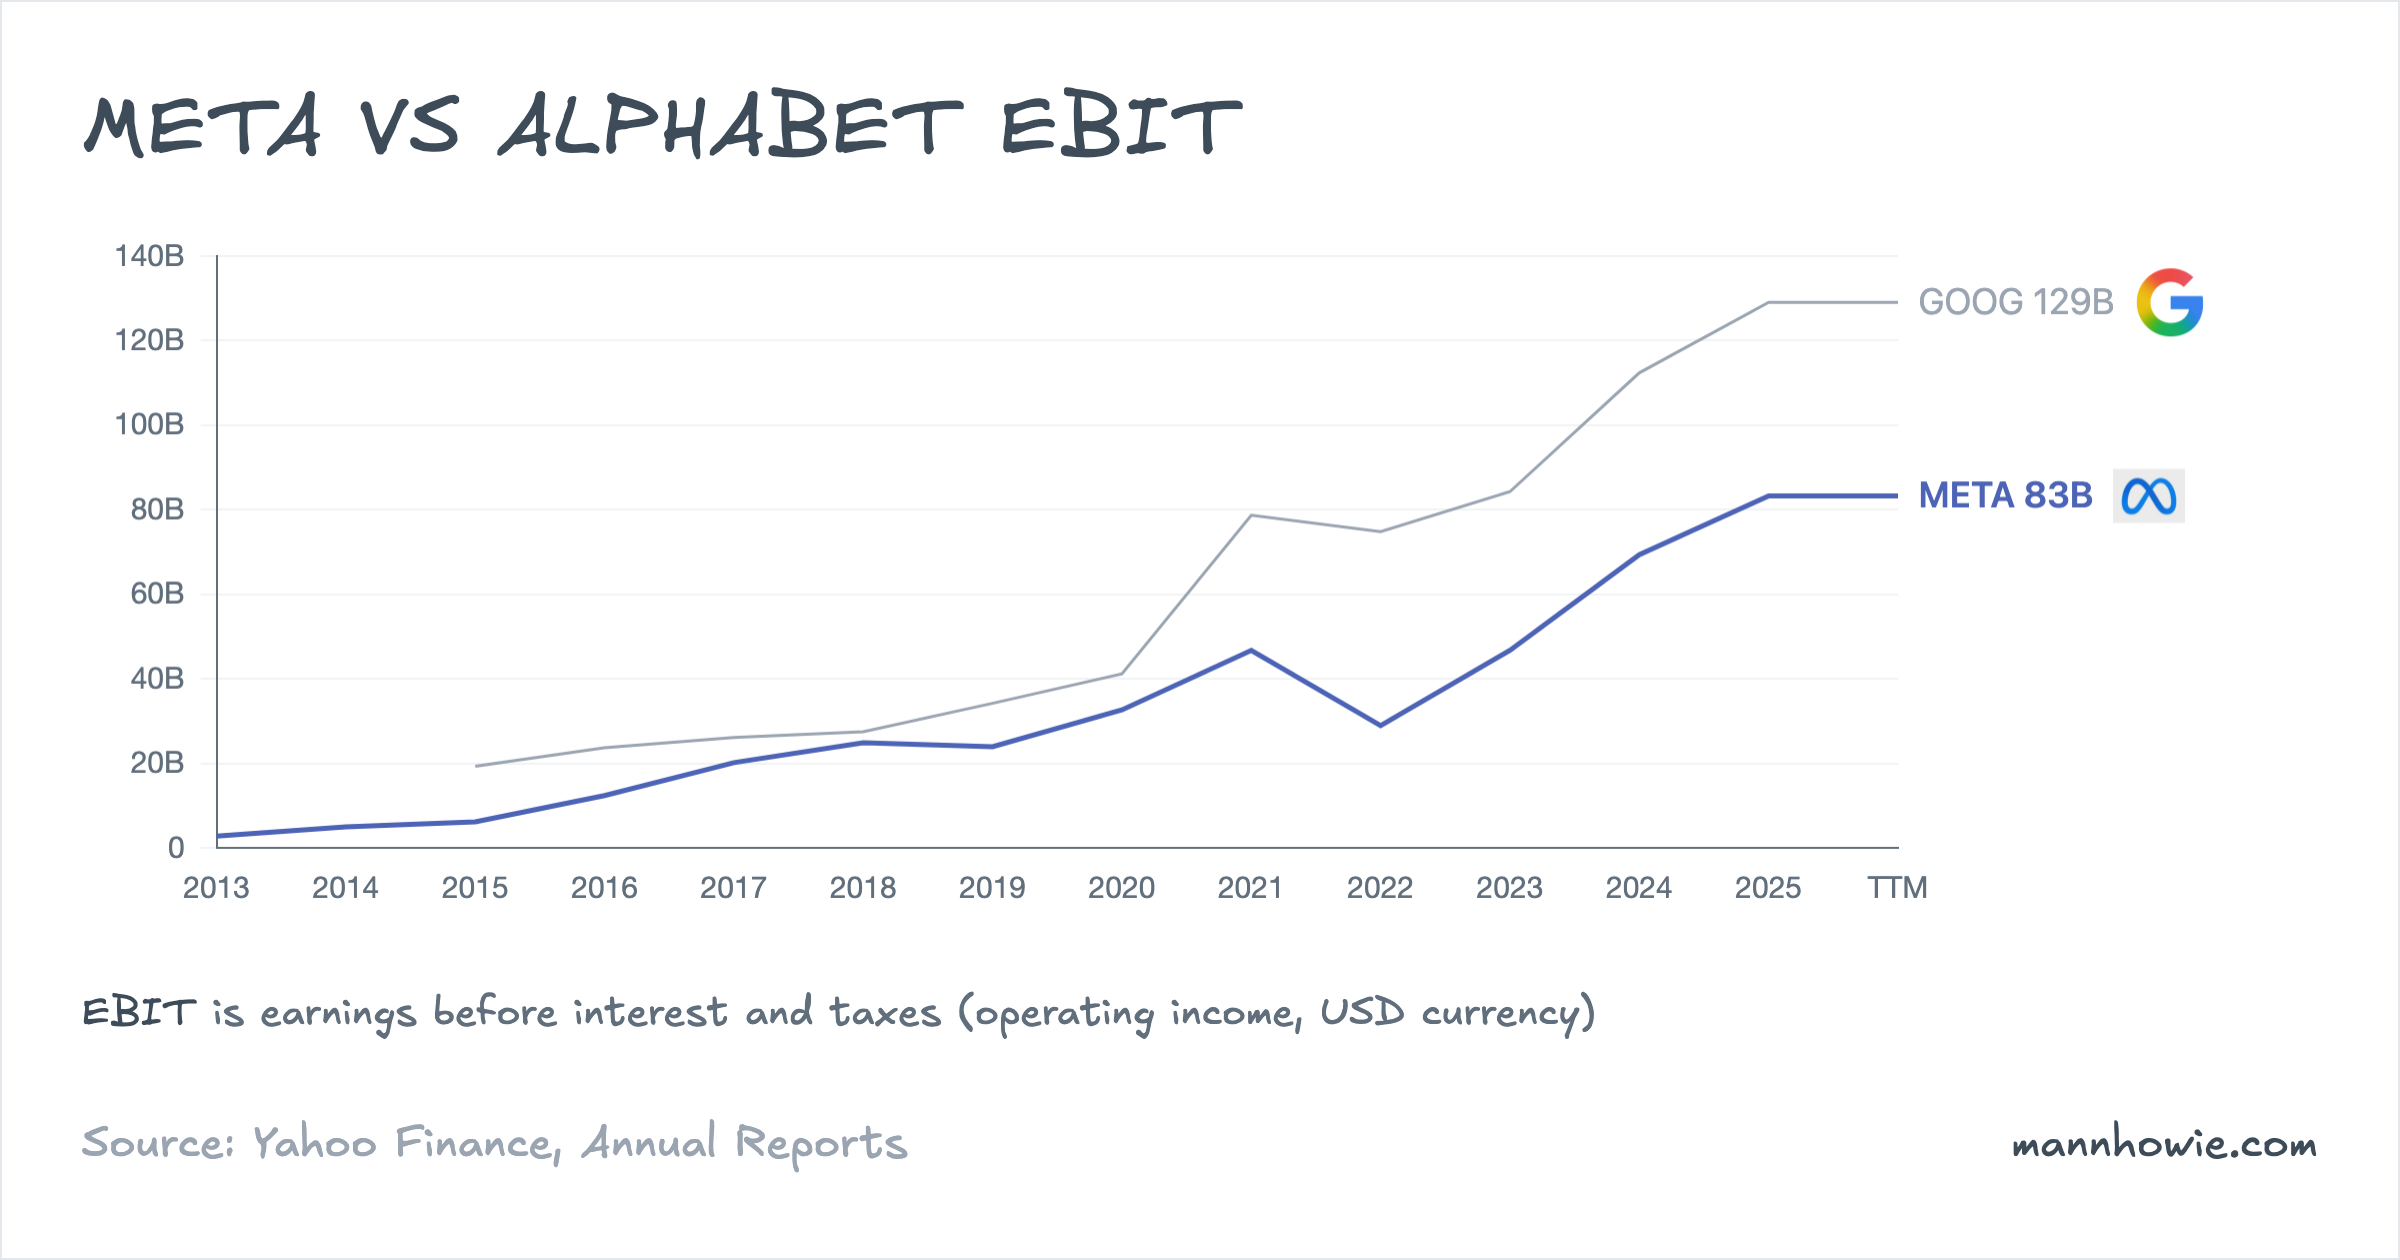
| EBIT | $83.3B | $129.0B | GOOG +$46B |
| Operating margin | 41.4% | 32.0% | META +9.4 pp |
| ROIC | 29.1% | 29.8% | ~parity |
| Gross margin | 82.0% | 59.7% | META +22.3 pp |
Meta converts about 41 cents of every revenue dollar into operating profit. Alphabet converts 32 cents. The gap starts at gross margin: Meta’s 82% reflects a pure software advertising model with no traffic acquisition costs, while Alphabet’s 60% reflects TAC payments to distribution partners, content costs for YouTube, and hardware costs for Pixel and Nest devices.
Despite the margin gap, both companies generate nearly identical returns on invested capital at roughly 29%. Meta achieves higher margins on a smaller capital base. Alphabet earns lower margins but deploys more capital across a broader set of businesses (Cloud, hardware, autonomous vehicles). The convergence in ROIC suggests the market’s higher valuation of Alphabet reflects the scale and diversification of its revenue streams rather than a difference in capital efficiency.
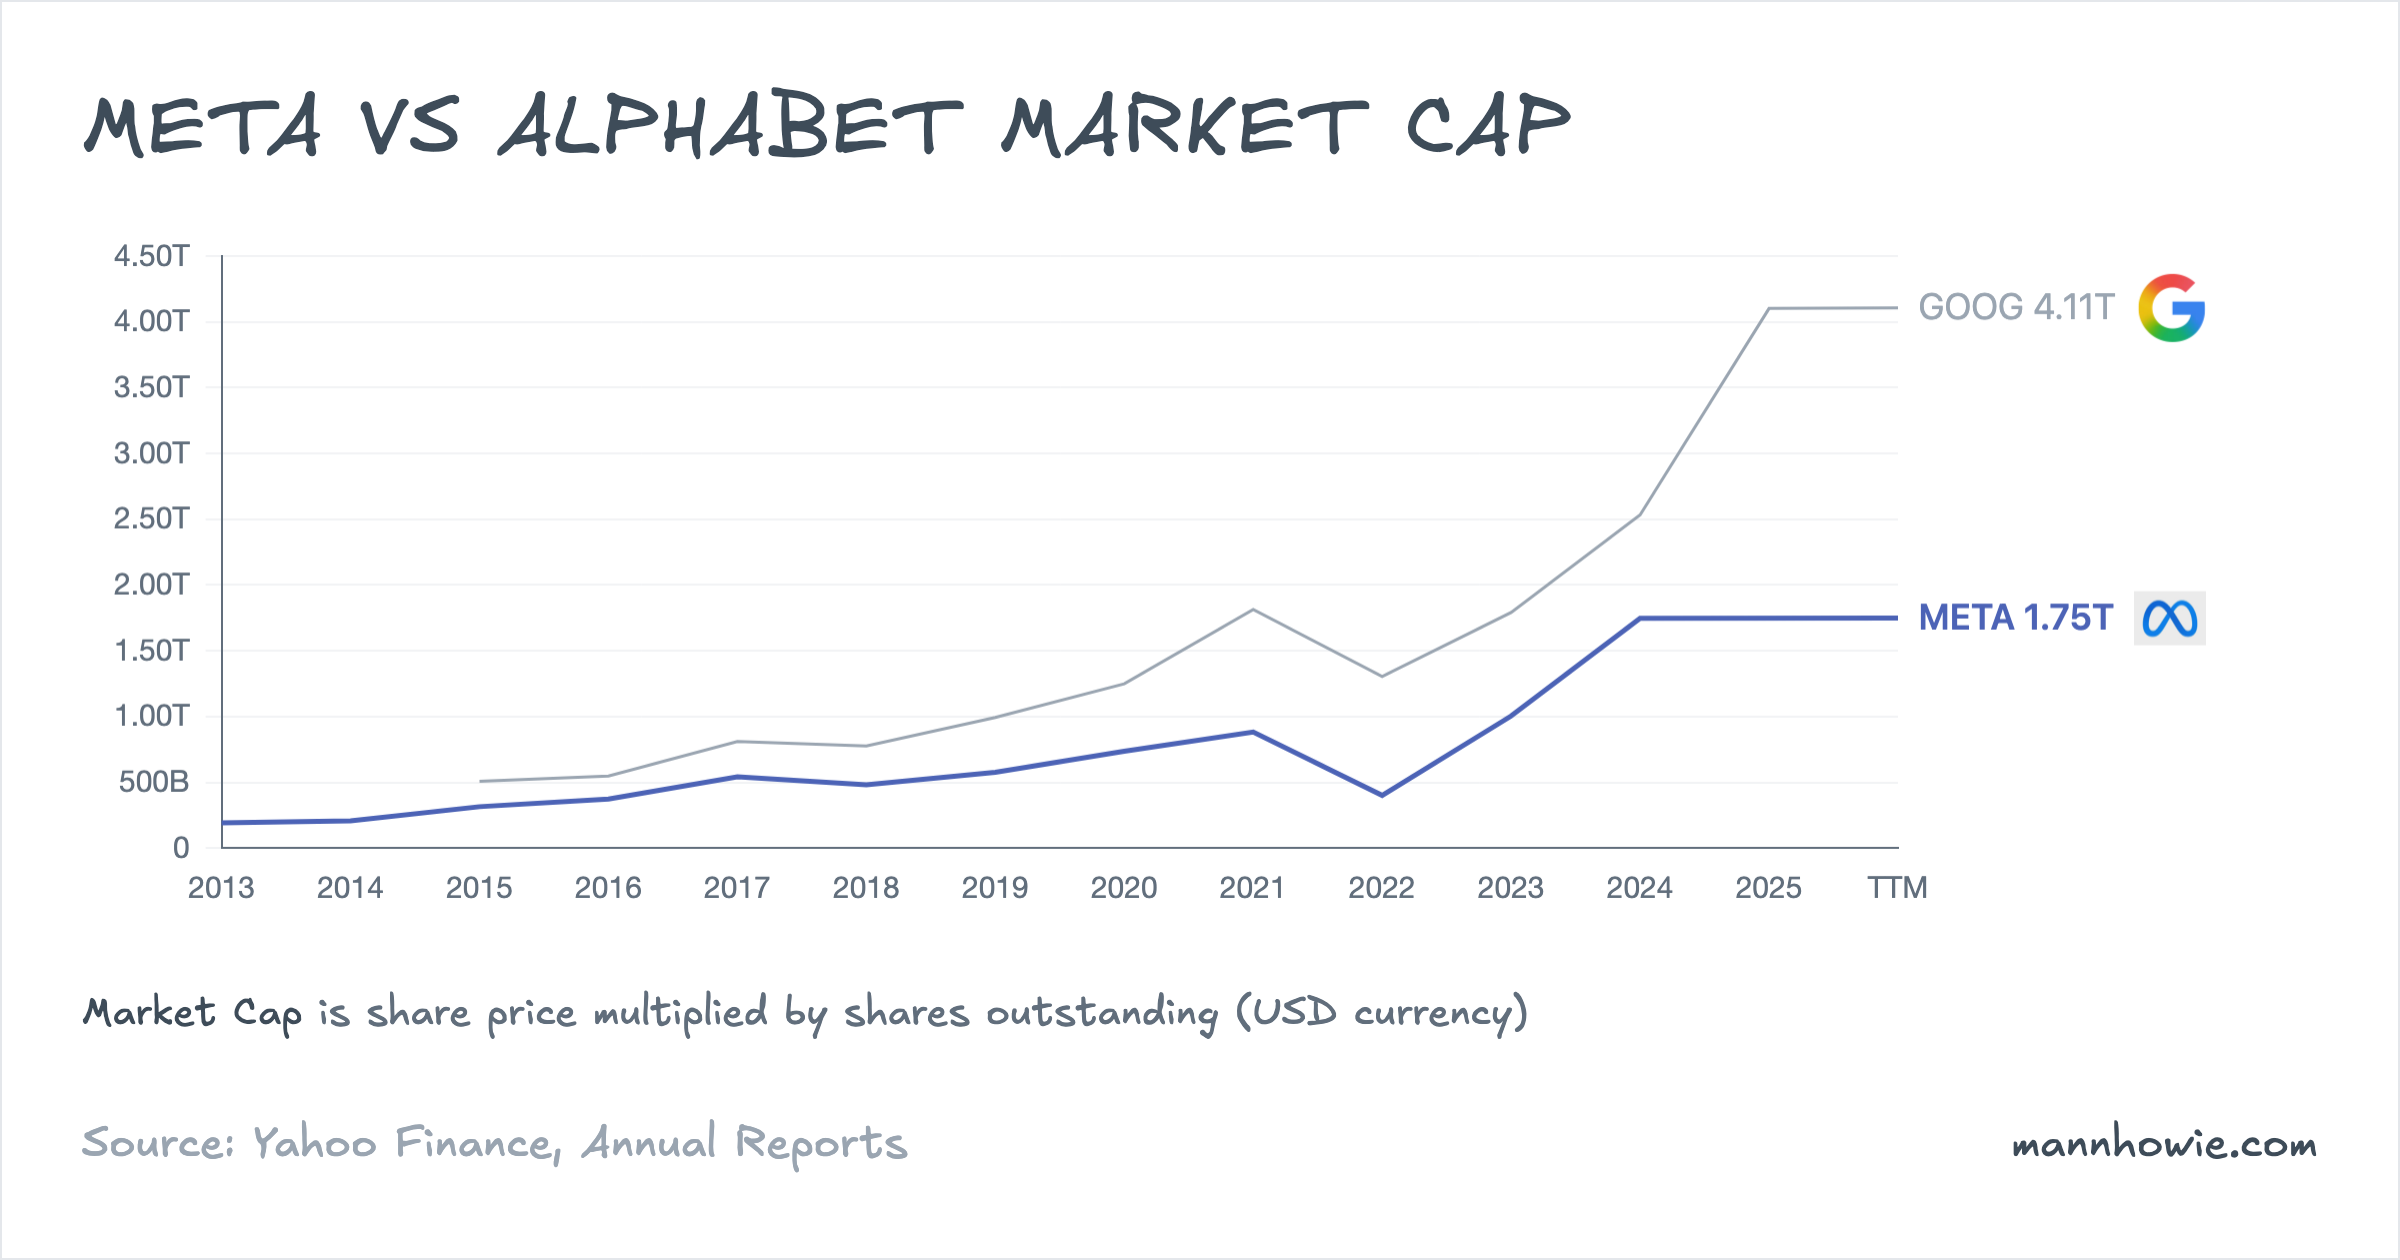
Equity markets value Alphabet at $4.11T and Meta at $1.75T. Alphabet trades at a P/E of 31x versus Meta’s 29x, and an EV/EBIT of 31x versus Meta’s 21x.
Meta: segment EBIT
| Segment (USD M) | FY2022 | FY2023 | FY2024 | FY2025 | % of FY25 EBIT | 3Y CAGR | 3Y Change ($) |
|---|---|---|---|---|---|---|---|
| Family of Apps | 42,661 | 62,871 | 87,109 | 102,469 | 123.0% | 33.9% | +59,808 |
| Reality Labs | (13,717) | (16,120) | (17,729) | (19,193) | -23.0% | n/m | -5,476 |
| Total | 28,944 | 46,751 | 69,380 | 83,276 | 100% | 42.2% | +54,332 |
Family of Apps generated $102B of operating profit in FY2025 at a 51.5% margin, up from 37% in FY2022. The margin expanded sharply from 2022 to 2024 as headcount reductions (Meta cut roughly 21,000 roles in late 2022 and 2023) took hold while revenue growth resumed. It compressed 2 percentage points to 52% in FY2025 as AI infrastructure depreciation and compute costs increased. FoA added $60B of operating profit in three years, the largest absolute increase of any segment at either company.
Reality Labs lost $19.2B in FY2025, up from $13.7B in FY2022. The loss has increased every year. Cumulative Reality Labs operating losses over FY2022 to FY2025 total $67B. FoA’s profits fund Reality Labs in full and underwrite the company’s AI infrastructure programme.
“We expect our 2026 RL operating losses to remain similar to 2025… our ability to support our RL efforts is dependent on generating sufficient profits from other areas of our business.”
— Meta 10-K FY2025, page 63
Alphabet: segment EBIT
| Segment (USD M) | FY2022 | FY2023 | FY2024 | FY2025 | % of FY25 EBIT | 3Y CAGR | 3Y Change ($) |
|---|---|---|---|---|---|---|---|
| Google Services | 82,699 | 95,858 | 121,263 | 139,404 | 108.0% | 19.0% | +56,705 |
| Google Cloud | (1,922) | 1,716 | 6,112 | 13,910 | 10.8% | n/m | +15,832 |
| Other Bets | (4,636) | (4,095) | (4,444) | (7,515) | -5.8% | n/m | -2,879 |
| Alphabet-level activities | (1,299) | (9,186) | (10,541) | (16,760) | -13.0% | n/m | -15,461 |
| Total | 74,842 | 84,293 | 112,390 | 129,039 | 100% | 19.9% | +54,197 |
Google Services produced $139B of operating profit at a 40.7% margin on $343B of revenue, adding $57B over three years. Google Cloud moved from a $1.9B loss in 2022 to $13.9B of profit in 2025, reaching a 23.7% margin as workload density increased and enterprise contract pricing improved. Cloud is the only Alphabet segment that turned from loss-making to profitable over the period.
Alphabet-level activities moved from a $1.3B loss to a $16.8B loss. This line carries centrally managed AI research costs (including Gemini development), corporate infrastructure and multi-billion-dollar regulatory settlements in the EU and US. Combined with Other Bets losses of $7.5B, Alphabet’s non-core costs totalled $24B in FY2025. Meta’s equivalent, Reality Labs, lost $19B. Both companies fund experimental businesses from their core advertising engines, though the bets differ: Meta is building a hardware and metaverse platform; Alphabet is funding autonomous vehicles (Waymo), life sciences (Verily) and centrally managed AI research. Google Services alone would rank among the most profitable companies in the world. The same is true of Meta’s Family of Apps.
Capital expenditure
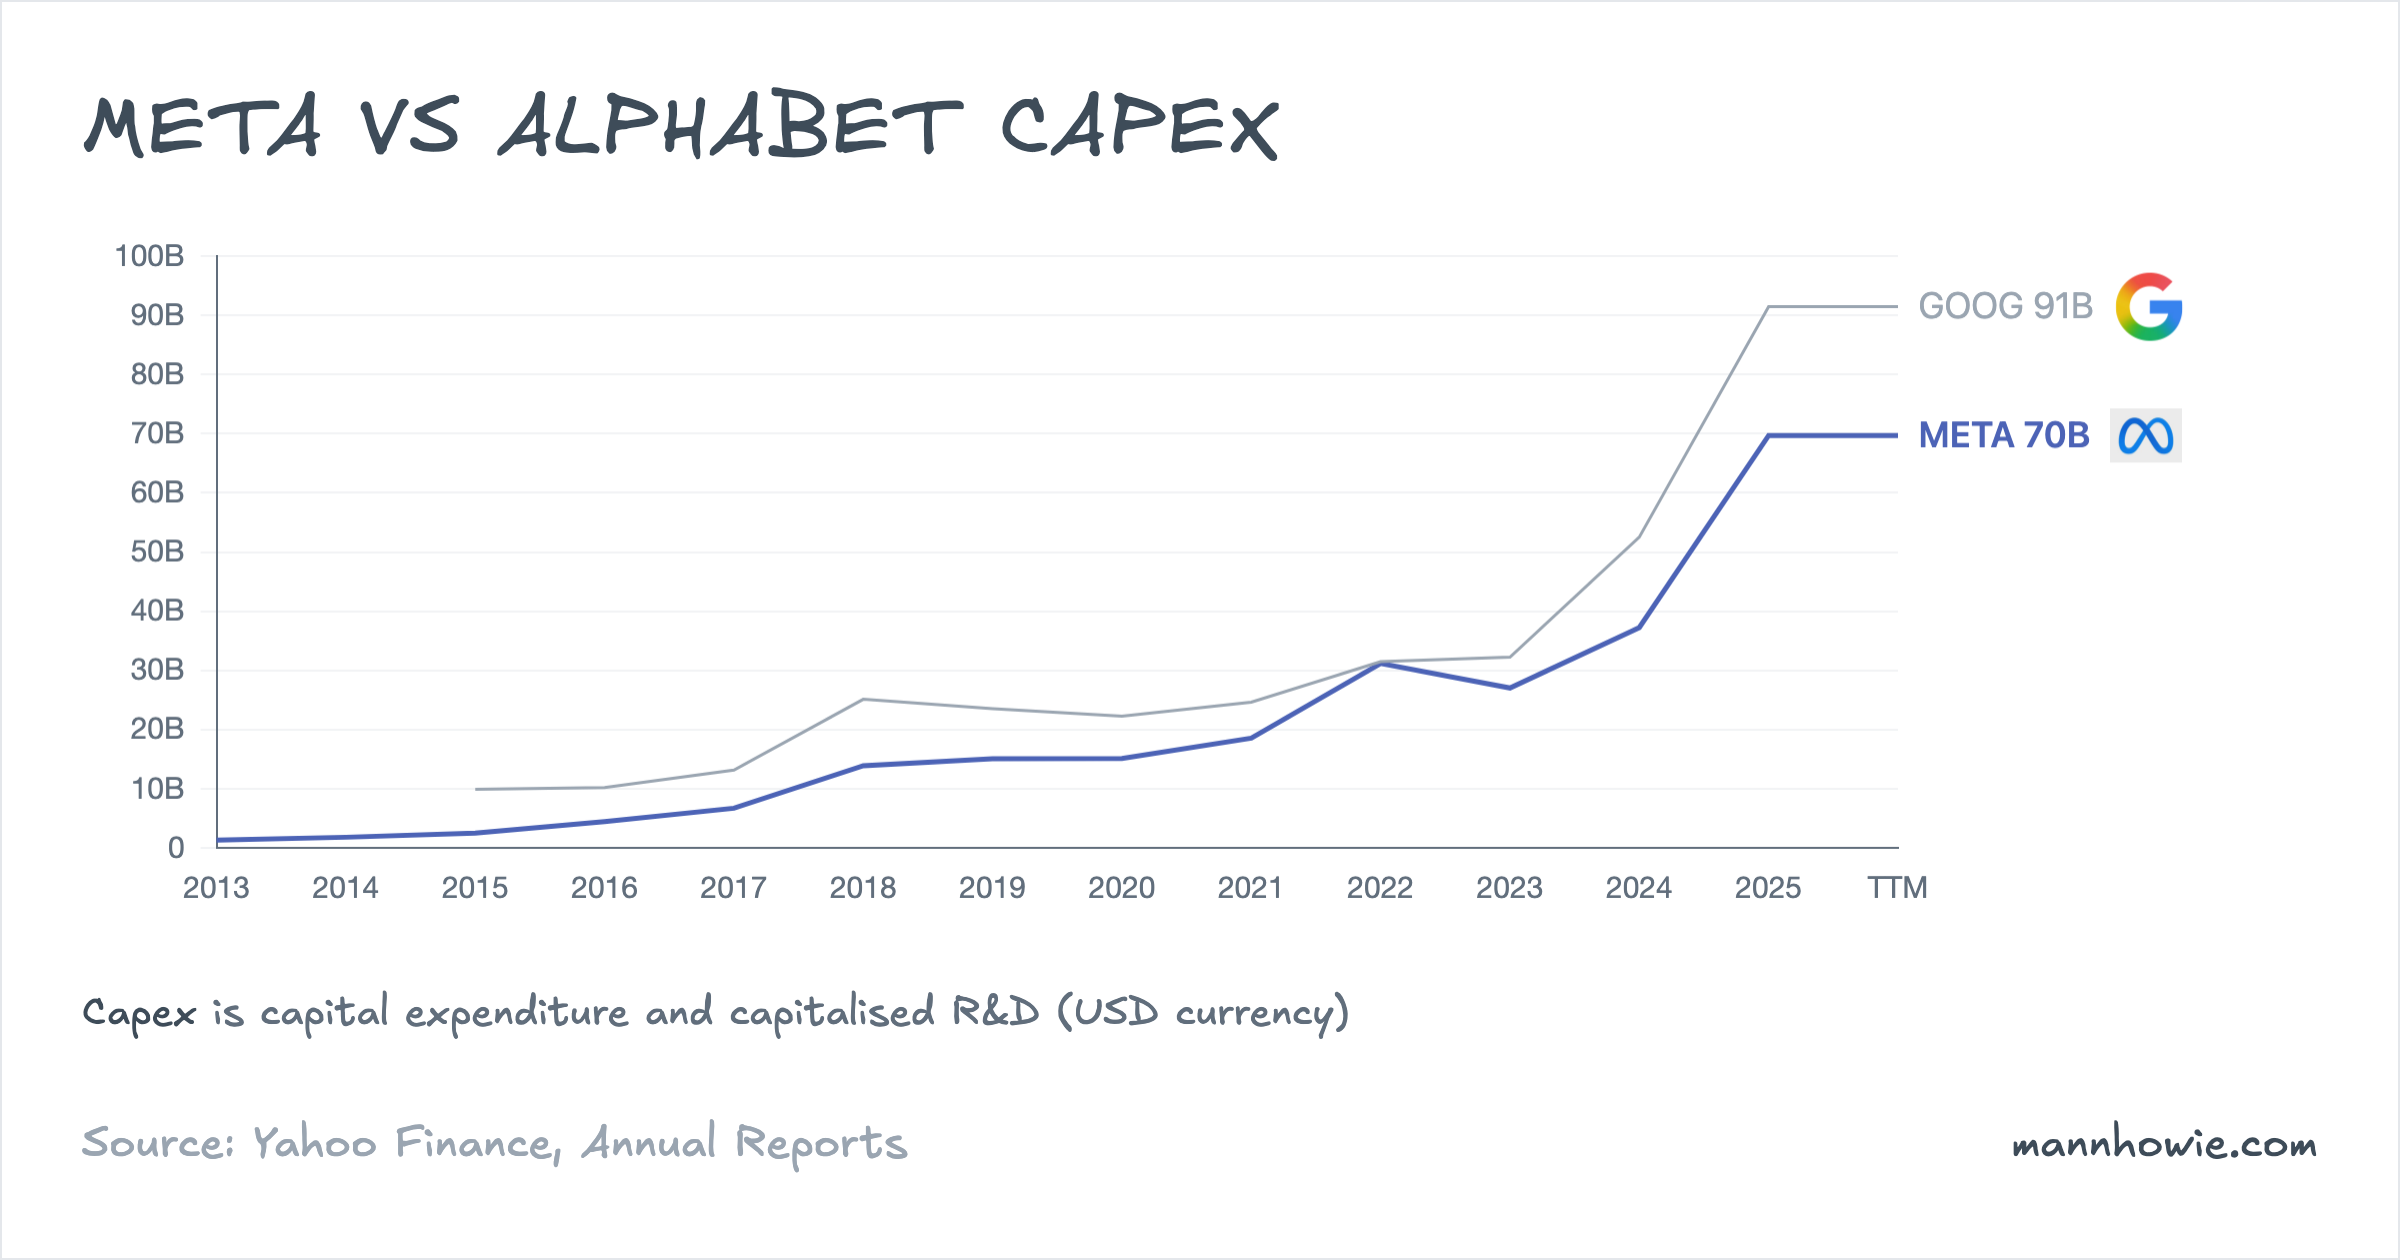
Both companies started FY2022 at roughly the same capex level, around $31B each. The paths have since diverged sharply, with AI infrastructure driving the acceleration.
| Capex (USD M) | FY2022 | FY2023 | FY2024 | FY2025 | 3Y Change |
|---|---|---|---|---|---|
| Meta | 31,186 | 27,045 | 37,256 | 69,691 | +$39B |
| Alphabet | 31,485 | 32,251 | 52,535 | 91,447 | +$60B |
Alphabet’s capex has nearly tripled. Meta’s has more than doubled. Both programmes fund datacentres, GPU clusters and custom silicon for AI workloads.
Meta’s trailing free cash flow fell from $37B in FY2024 to $26B in FY2025 as capex nearly doubled from $37B to $70B. Alphabet maintained $48B in trailing free cash flow despite $91B of capex, because its $129B of operating profit absorbs the spend more comfortably than Meta’s $83B covers its $70B outlay. Both companies remain free-cash-flow positive, but the margin of safety has narrowed as AI capex accelerates.
Meta has developed custom training silicon (MTIA) and is expanding datacentre capacity to support its Llama open-weight model family and AI-driven ad targeting and recommendation systems. Alphabet’s TPU, now in its sixth generation, powers internal workloads (Search ranking, YouTube recommendations, Gemini) and Google Cloud’s AI inference offering. Both companies have signed multi-year power purchase agreements and are building datacentre campuses across multiple continents to secure the energy and compute needed for training and inference at scale.
Sources
- Meta 10-K FY2024, pages 60, 72, 121 (segment results, revenue disaggregation, segment information note).
- Meta 10-K FY2025, pages 61, 63, 73, 126 (segment results, Reality Labs commentary, revenue disaggregation, segment information note).
- Alphabet 10-K FY2024, pages 63, 87–88 (revenue disaggregation, segment revenue, segment operating income).
- Alphabet 10-K FY2025, pages 60, 86–88 (revenue disaggregation, segment revenue, segment operating income).