Amazon vs Alphabet: Retail Scale, AWS Growth and AI Capex
10 minute read | Apr 7, 2026 | Reviewed by Howie Mann
Amazon sells products online, lets other sellers use its marketplace for a fee, and rents cloud computing to businesses through AWS. It earns money from retail sales, seller and advertising fees, and AWS usage charges.
Alphabet runs Google Search, YouTube, and a cloud computing platform. It earns money from search and YouTube ads, ads placed on third-party websites, Google Cloud fees, and consumer subscriptions such as YouTube Premium.
Revenue
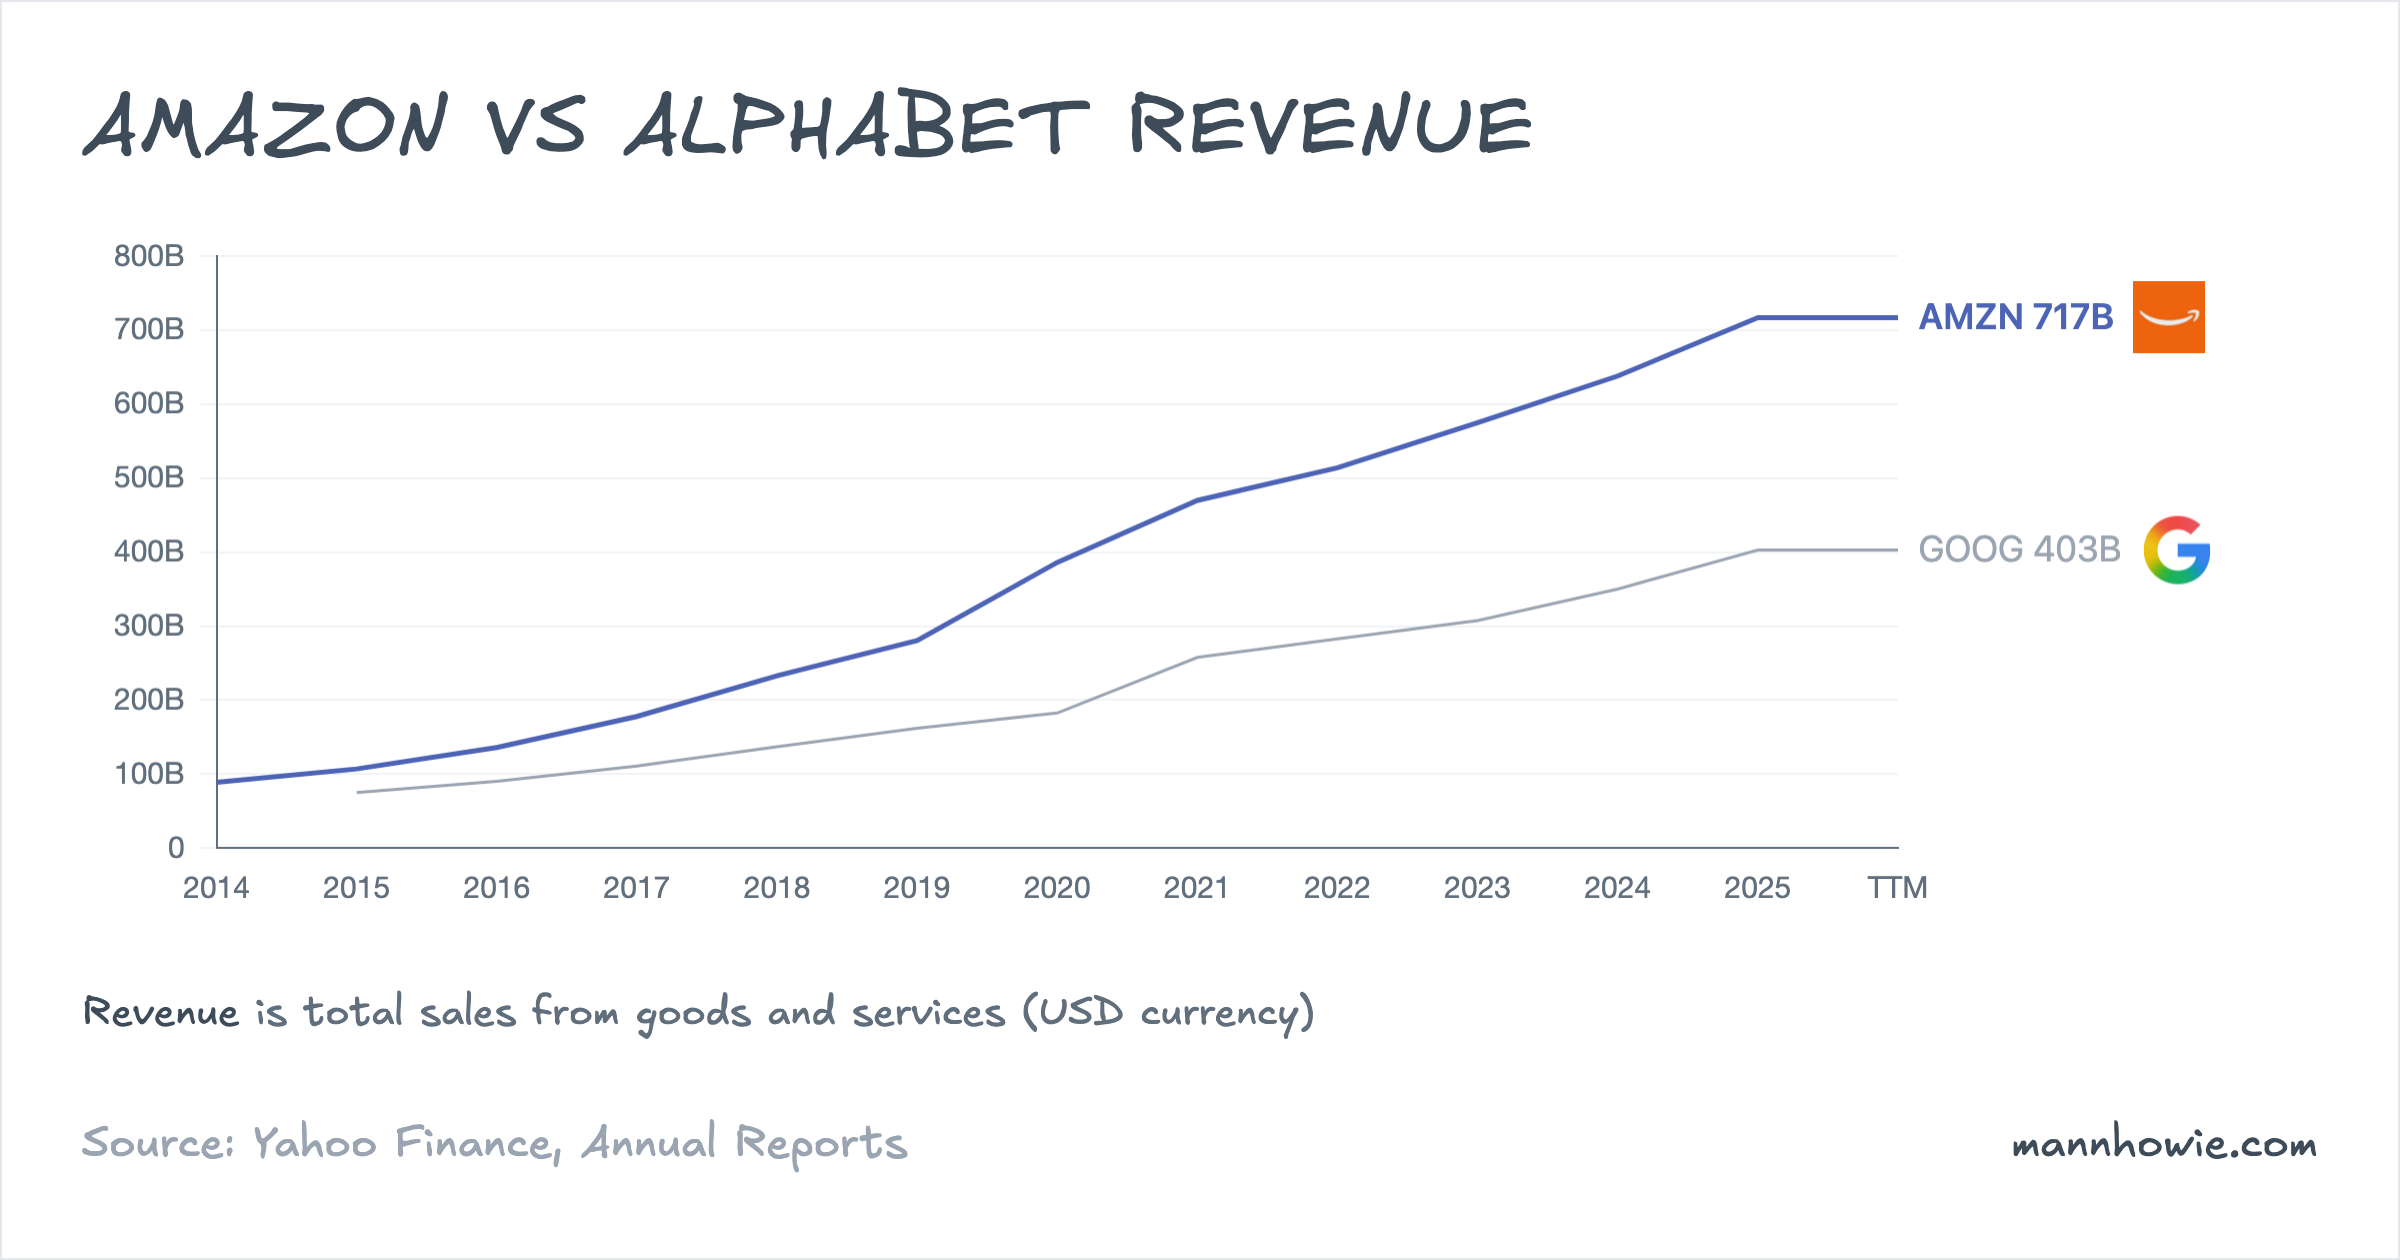
Amazon’s top line is nearly twice Alphabet’s and the ratio has held steady for three years. Between 2022 and 2025, Amazon grew revenue at an 11.7% compound annual rate and added roughly $203B of sales. Alphabet grew slightly faster at 12.5% but added about $120B, reflecting its smaller base.
Revenue mix explains most of what follows. Amazon’s largest lines, Online stores and Third-party seller services, are retail businesses with thin gross margins. Alphabet’s revenue is dominated by advertising, which converts to operating profit at a rate multiples higher. A dollar of revenue at Amazon and a dollar at Alphabet are not economically equivalent.
Amazon: revenue by product line
Seven product and service lines sit inside Amazon’s three reportable segments.
| Line item (USD M) | FY2022 | FY2023 | FY2024 | FY2025 | % of FY25 | 3Y CAGR | 3Y Change ($) |
|---|---|---|---|---|---|---|---|
| Online stores | 220,004 | 231,872 | 247,029 | 269,287 | 37.6% | 7.0% | +49,283 |
| Third-party seller services | 117,716 | 140,053 | 156,146 | 172,162 | 24.0% | 13.5% | +54,446 |
| AWS | 80,096 | 90,757 | 107,556 | 128,725 | 18.0% | 17.1% | +48,629 |
| Advertising services | 37,739 | 46,906 | 56,214 | 68,635 | 9.6% | 22.0% | +30,896 |
| Subscription services | 35,218 | 40,209 | 44,374 | 49,619 | 6.9% | 12.1% | +14,401 |
| Physical stores | 18,963 | 20,030 | 21,215 | 22,561 | 3.1% | 6.0% | +3,598 |
| Other | 4,247 | 4,958 | 5,425 | 5,935 | 0.8% | 11.8% | +1,688 |
| Consolidated | 513,983 | 574,785 | 637,959 | 716,924 | 100% | 11.7% | +202,941 |
Online stores remains the largest line and the slowest grower at 7% compound annual growth. Third-party seller services added the most absolute revenue over the three-year window at roughly $54B, narrowly ahead of AWS at $49B. Advertising services posted the highest growth rate at 22%, but off a smaller base; in dollar terms it added less than AWS.
Taken together, AWS and Advertising services moved from a combined $118B in 2022 to $197B in 2025, a $80B increase. That is larger than the absolute growth of Amazon’s North America retail business over the same period, and it is these two lines that drive most of the group’s operating profit.
Alphabet: revenue by product line
Alphabet discloses five product lines across two operating segments (Google Services and Google Cloud) plus Other Bets. Hedging gains and losses sit outside the segments and can swing quarterly totals without affecting the underlying business.
| Line item (USD M) | FY2022 | FY2023 | FY2024 | FY2025 | % of FY25 | 3Y CAGR | 3Y Change ($) |
|---|---|---|---|---|---|---|---|
| Google Search & other | 162,450 | 175,033 | 198,084 | 224,532 | 55.7% | 11.4% | +62,082 |
| Google Cloud | 26,280 | 33,088 | 43,229 | 58,705 | 14.6% | 30.8% | +32,425 |
| Subscriptions, platforms, devices | 29,055 | 34,688 | 40,340 | 48,030 | 11.9% | 18.2% | +18,975 |
| YouTube ads | 29,243 | 31,510 | 36,147 | 40,367 | 10.0% | 11.3% | +11,124 |
| Google Network | 32,780 | 31,312 | 30,359 | 29,792 | 7.4% | -3.1% | -2,988 |
| Other Bets | 1,068 | 1,527 | 1,648 | 1,537 | 0.4% | 12.9% | +469 |
| Hedging gains/(losses) | 1,960 | 236 | 211 | (127) | 0.0% | n/m | -2,087 |
| Total revenues | 282,836 | 307,394 | 350,018 | 402,836 | 100% | 12.5% | +120,000 |
Google Search accounts for 56% of Alphabet’s revenue and continues to grow at 11% compound annual. It contributed roughly $62B of additional revenue over three years, the largest absolute increase of any single product line at either company apart from Amazon’s Online stores.
Google Cloud is Alphabet’s fastest-growing line at 31% compound annual, adding about $32B. Google Network, the business that places Google ads on third-party websites, is the only line in contraction. First-party surfaces (Search, YouTube) continue to grow; syndicated advertising on the open web does not.
Amazon’s advertising line grew at 22% compound annual versus 9.5% for Alphabet’s total advertising business. In dollar terms the comparison is different: Alphabet’s ads business added roughly $70B over three years, more than twice the $31B added by Amazon ads. Both the growth rate gap and the absolute dollar gap are widening, in opposite directions.
EBIT and margins
The two businesses diverge most sharply on profitability.
| Metric (TTM) | Amazon | Alphabet | Gap |
|---|---|---|---|
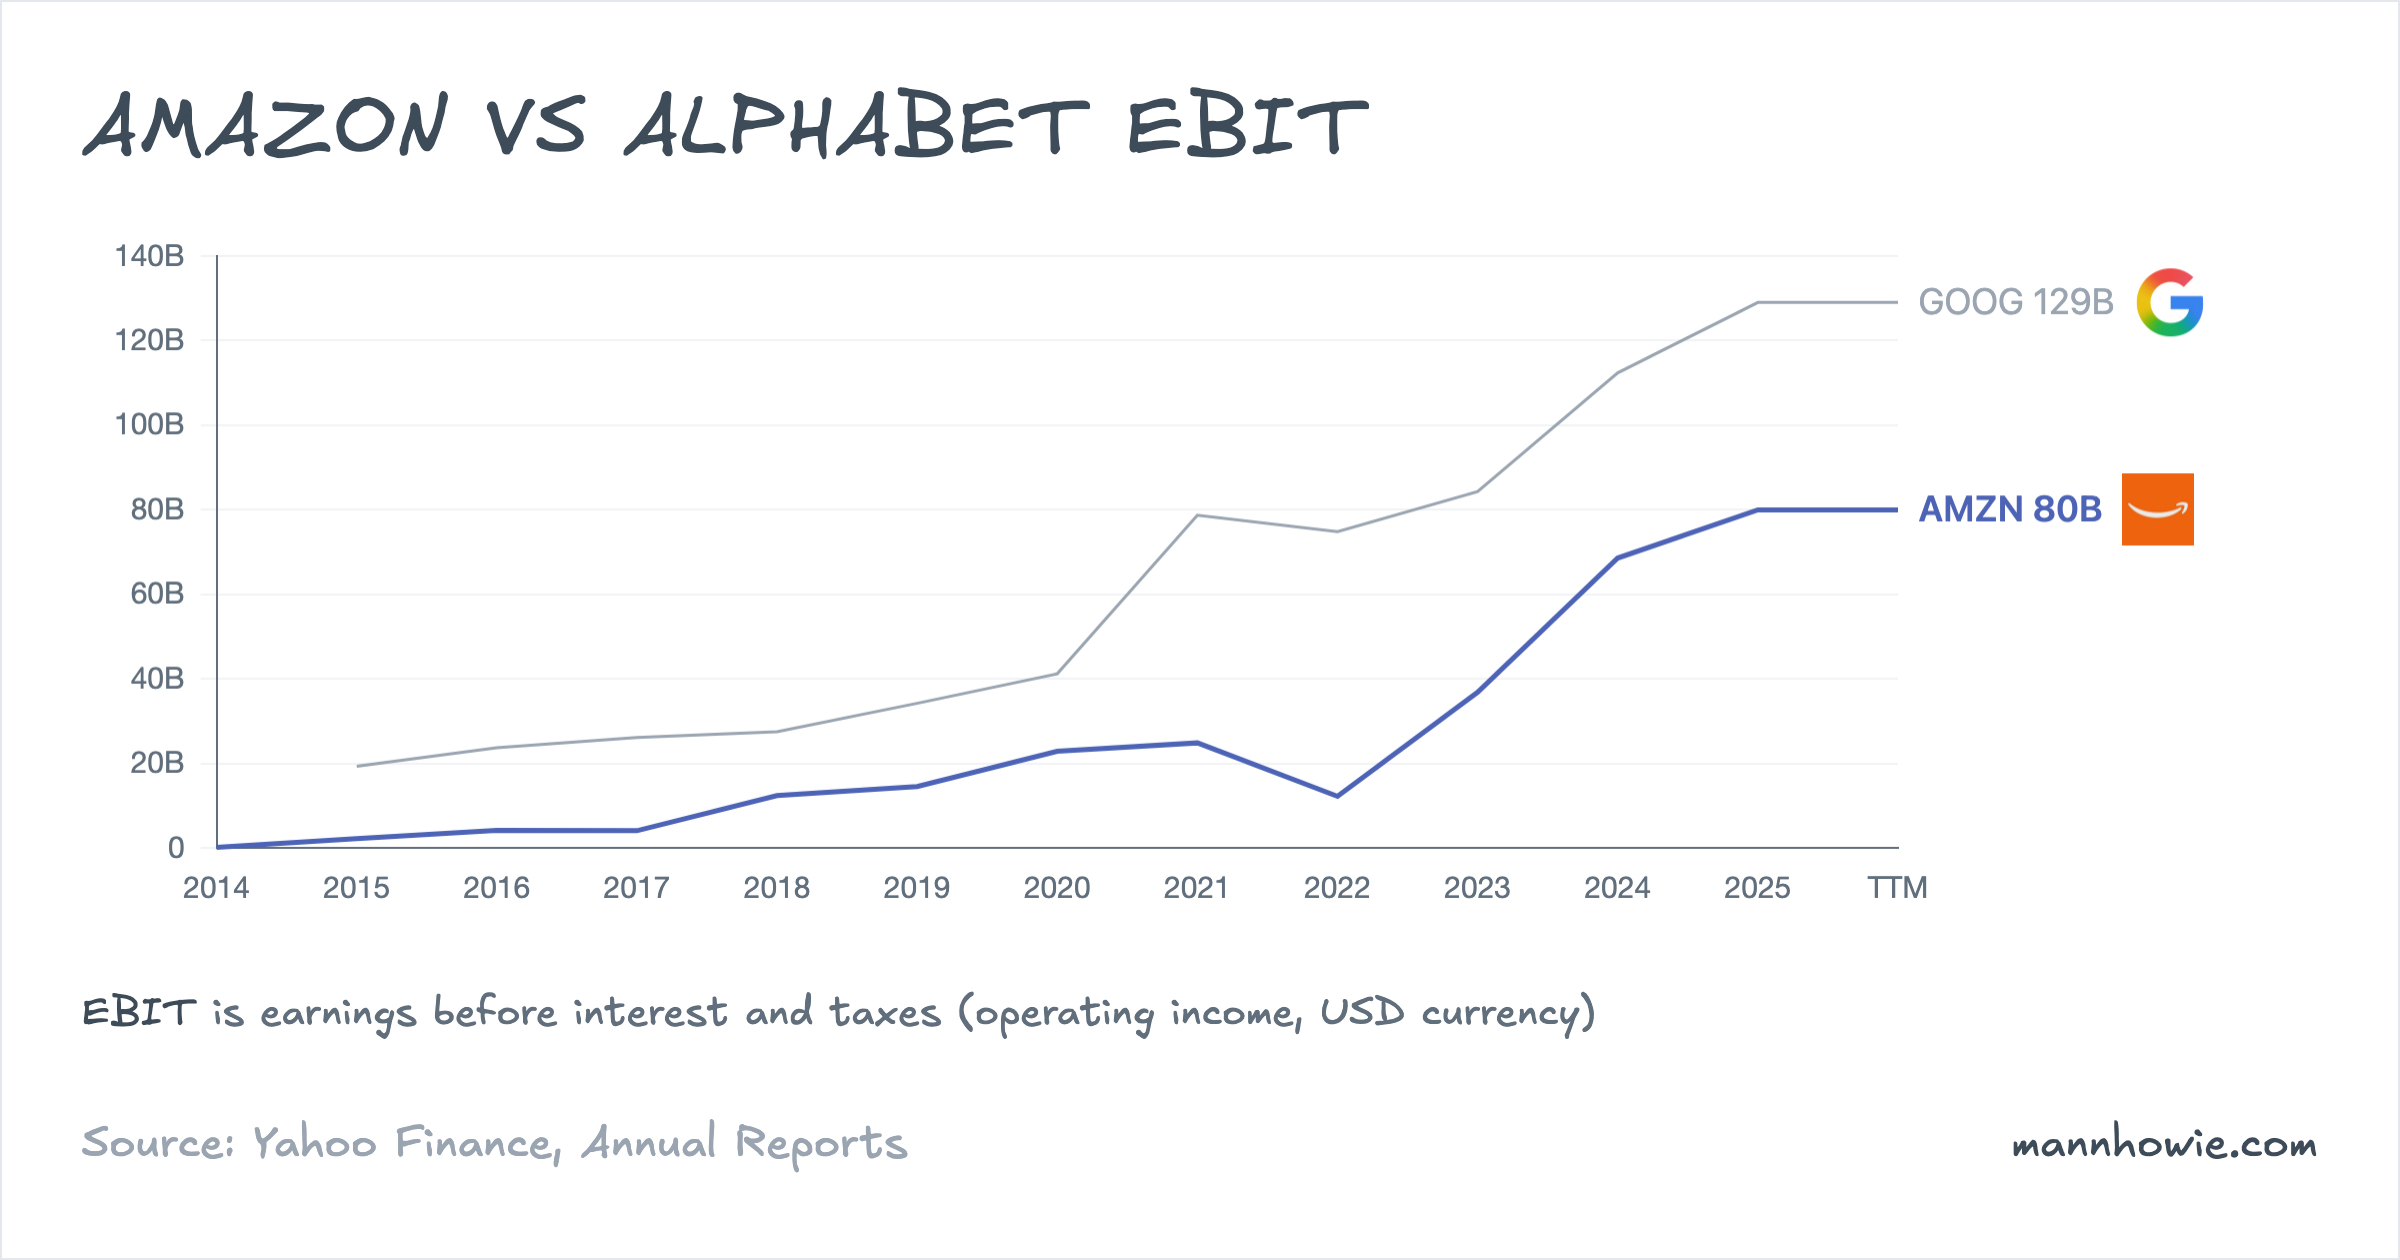
| Revenue | $716.9B | $402.8B | AMZN +78% |
| EBIT | $80.0B | $129.0B | GOOG +$49B |
| Operating margin | 11.2% | 32.0% | GOOG +20.9 pp |
| ROIC | 16.5% | 29.9% | GOOG +13.3 pp |
| Gross margin | 50.3% | 59.7% | GOOG +9.4 pp |
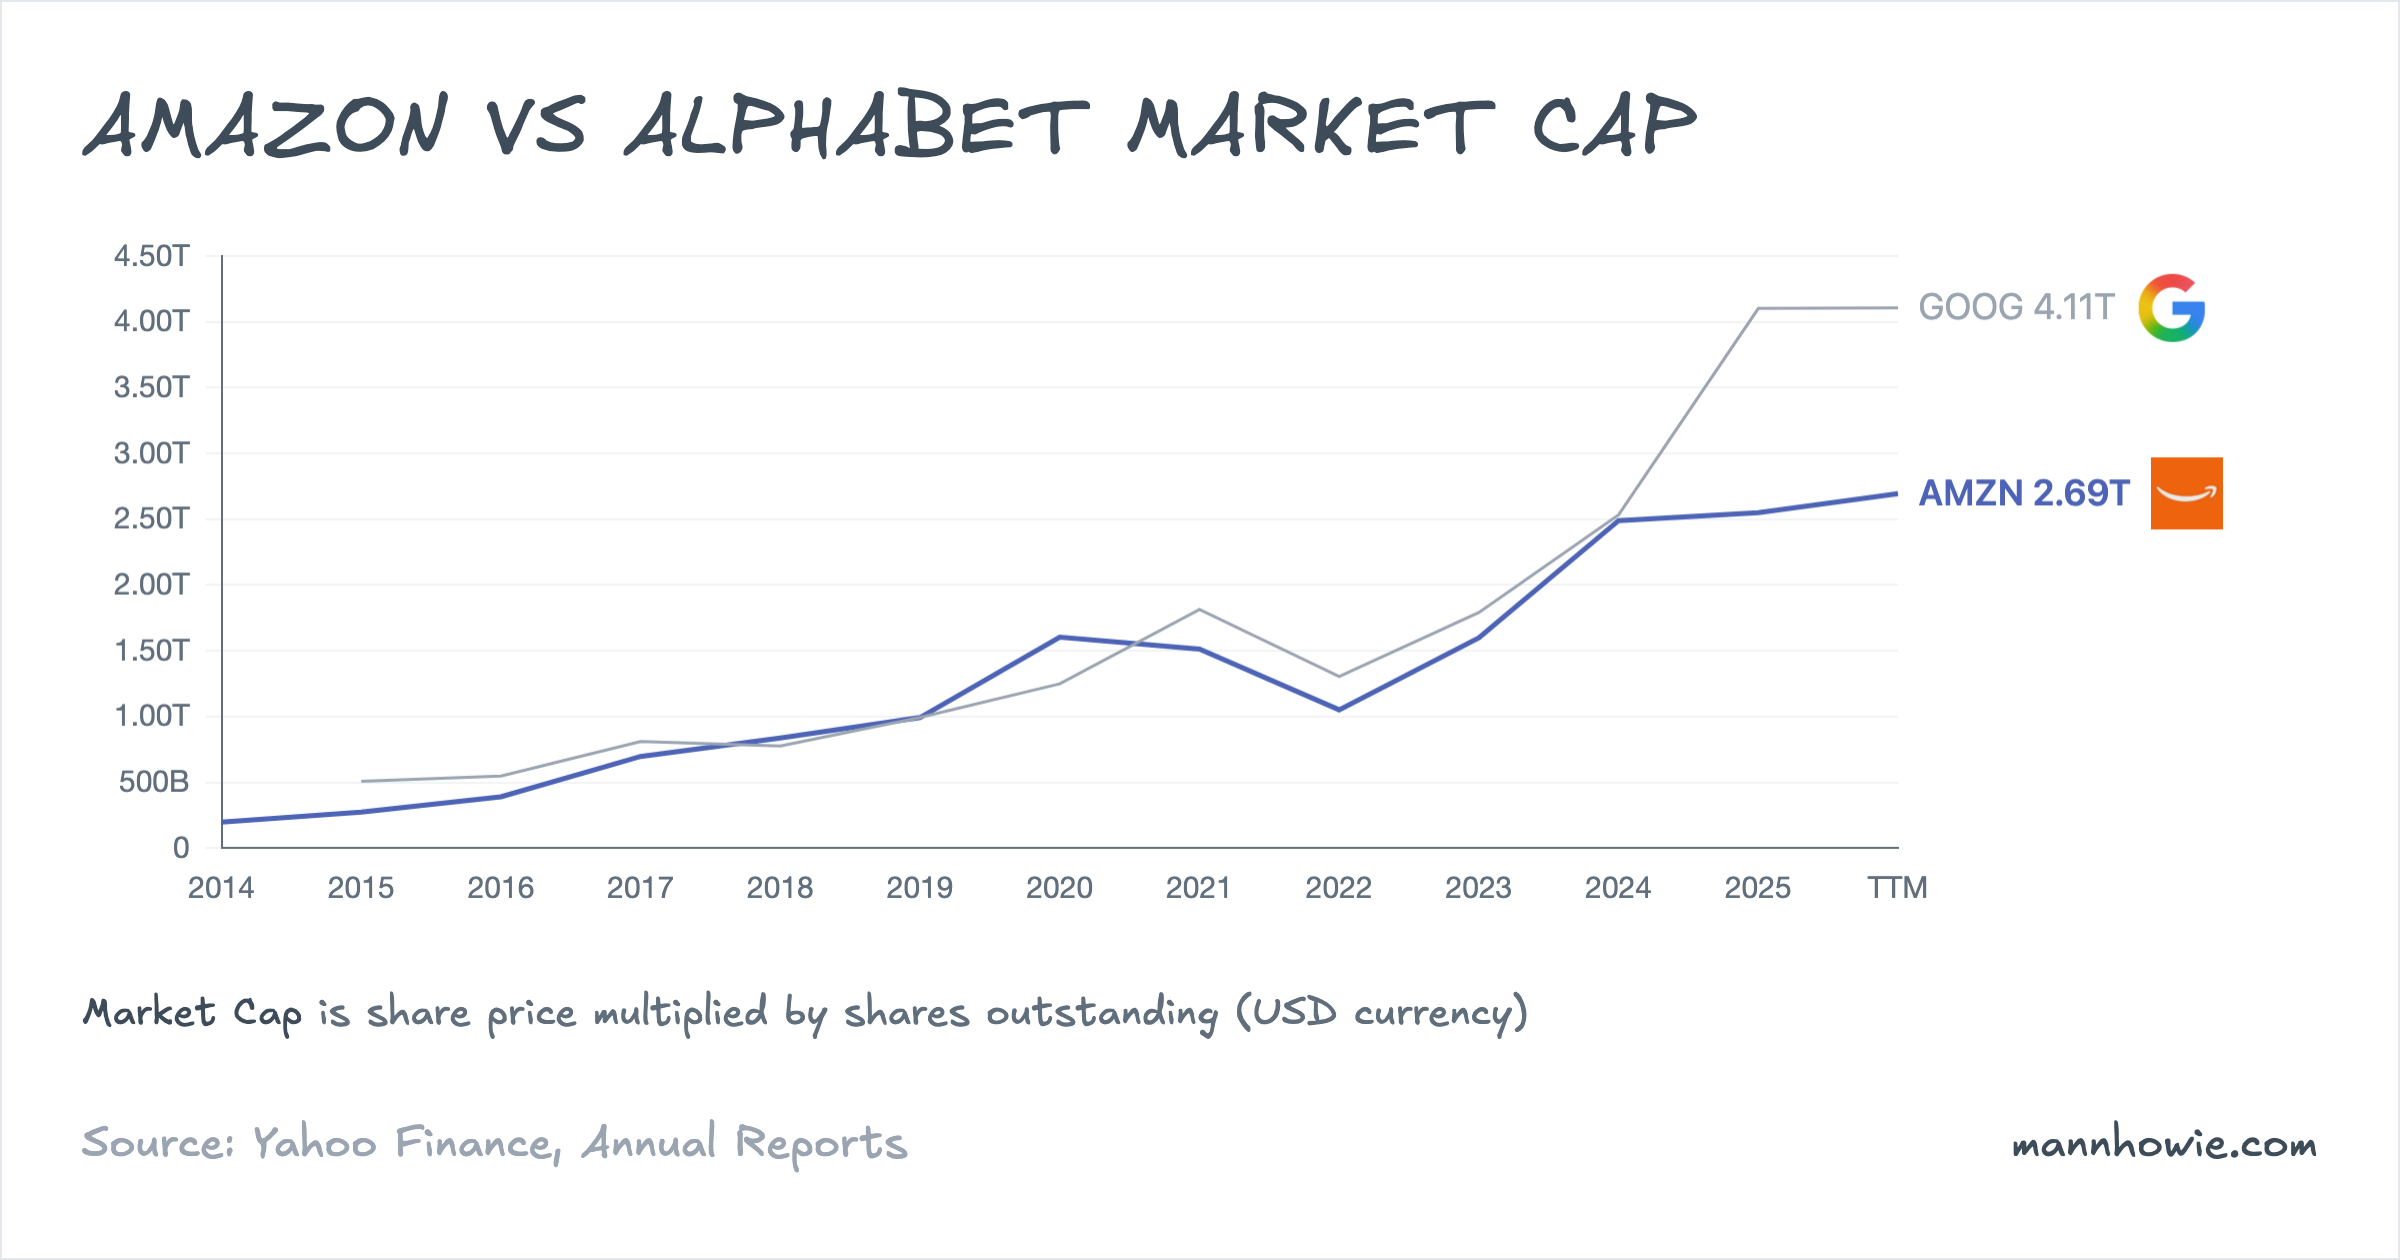
Alphabet converts about 32 cents of every revenue dollar into operating profit. Amazon converts about 11 cents. The difference holds at the return-on-capital level as well, with Alphabet’s ROIC running roughly 13 percentage points higher. Equity markets reflect this: Alphabet’s market capitalisation stands at $4.11T compared with Amazon’s $2.69T, despite Amazon’s larger top line.
Amazon: segment EBIT
Amazon reports three segments.
| Segment (USD M) | FY2022 | FY2023 | FY2024 | FY2025 | % of FY25 EBIT | 3Y CAGR | 3Y Change ($) |
|---|---|---|---|---|---|---|---|
| AWS | 22,841 | 24,631 | 39,834 | 45,606 | 57.0% | 25.9% | +22,765 |
| North America | (2,847) | 14,877 | 24,967 | 29,619 | 37.0% | n/m | +32,466 |
| International | (7,746) | (2,656) | 3,792 | 4,750 | 5.9% | n/m | +12,496 |
| Consolidated | 12,248 | 36,852 | 68,593 | 79,975 | 100% | 86.9% | +67,727 |
AWS generates 18% of Amazon’s revenue but 57% of its operating profit, at a 35.4% operating margin on $128.7B of sales. North America retail swung from a $2.8B operating loss in 2022 to a $29.6B profit in 2025, a $32B improvement attributed by management to a regionalised fulfilment network, tighter headcount growth and higher throughput per facility. The International segment followed a similar trajectory at smaller scale, turning profitable in 2024.
The 87% consolidated EBIT CAGR should be read in context. The 2022 base of $12B included a Rivian investment writedown and an overbuilt cost structure following pandemic-era expansion. On a 2023-to-2025 basis, consolidated EBIT has roughly doubled.
Alphabet: segment EBIT
Alphabet reports two operating segments plus Other Bets and a line for Alphabet-level activities, which holds centrally managed costs such as general AI research and corporate legal expenses.
| Segment (USD M) | FY2022 | FY2023 | FY2024 | FY2025 | % of FY25 EBIT | 3Y CAGR | 3Y Change ($) |
|---|---|---|---|---|---|---|---|
| Google Services | 82,699 | 95,858 | 121,263 | 139,404 | 108.0% | 19.0% | +56,705 |
| Google Cloud | (1,922) | 1,716 | 6,112 | 13,910 | 10.8% | n/m | +15,832 |
| Other Bets | (4,636) | (4,095) | (4,444) | (7,515) | -5.8% | n/m | -2,879 |
| Alphabet-level activities | (1,299) | (9,186) | (10,541) | (16,760) | -13.0% | n/m | -15,461 |
| Total | 74,842 | 84,293 | 112,390 | 129,039 | 100% | 19.9% | +54,197 |
Google Services alone produced $139B of operating profit in 2025, exceeding Amazon’s entire consolidated operating profit. Its segment operating margin of 40.7% on a $343B base is the primary driver of group profitability.
Google Cloud moved from a $1.9B operating loss in 2022 to $13.9B of operating profit in 2025, a margin of 23.7% on $58.7B of revenue. The shift reflects rising utilisation of existing infrastructure and pricing discipline on enterprise contracts. Google Cloud’s margin remains below AWS’s 35.4%, reflecting AWS’s larger scale and denser workload base.
Alphabet-level activities moved from a $1.3B loss in 2022 to a $16.8B loss in 2025. The line carries costs associated with general AI model development (including Gemini), central AI infrastructure, and multi-billion-dollar regulatory settlements in the European Union and the United States.
“Looking to the future, the next big step will be for the very concept of the ‘device’ to fade away. Over time, the computer itself—whatever its form factor—will be an intelligent assistant helping you through your day. We will move from mobile first to an AI first world.”
— Sundar Pichai, Alphabet Founders’ Letter, 2016
Capital expenditure
Capital expenditure has risen sharply at both companies.
| Capex (USD M) | FY2022 | FY2023 | FY2024 | FY2025 (TTM) | 3Y Change |
|---|---|---|---|---|---|
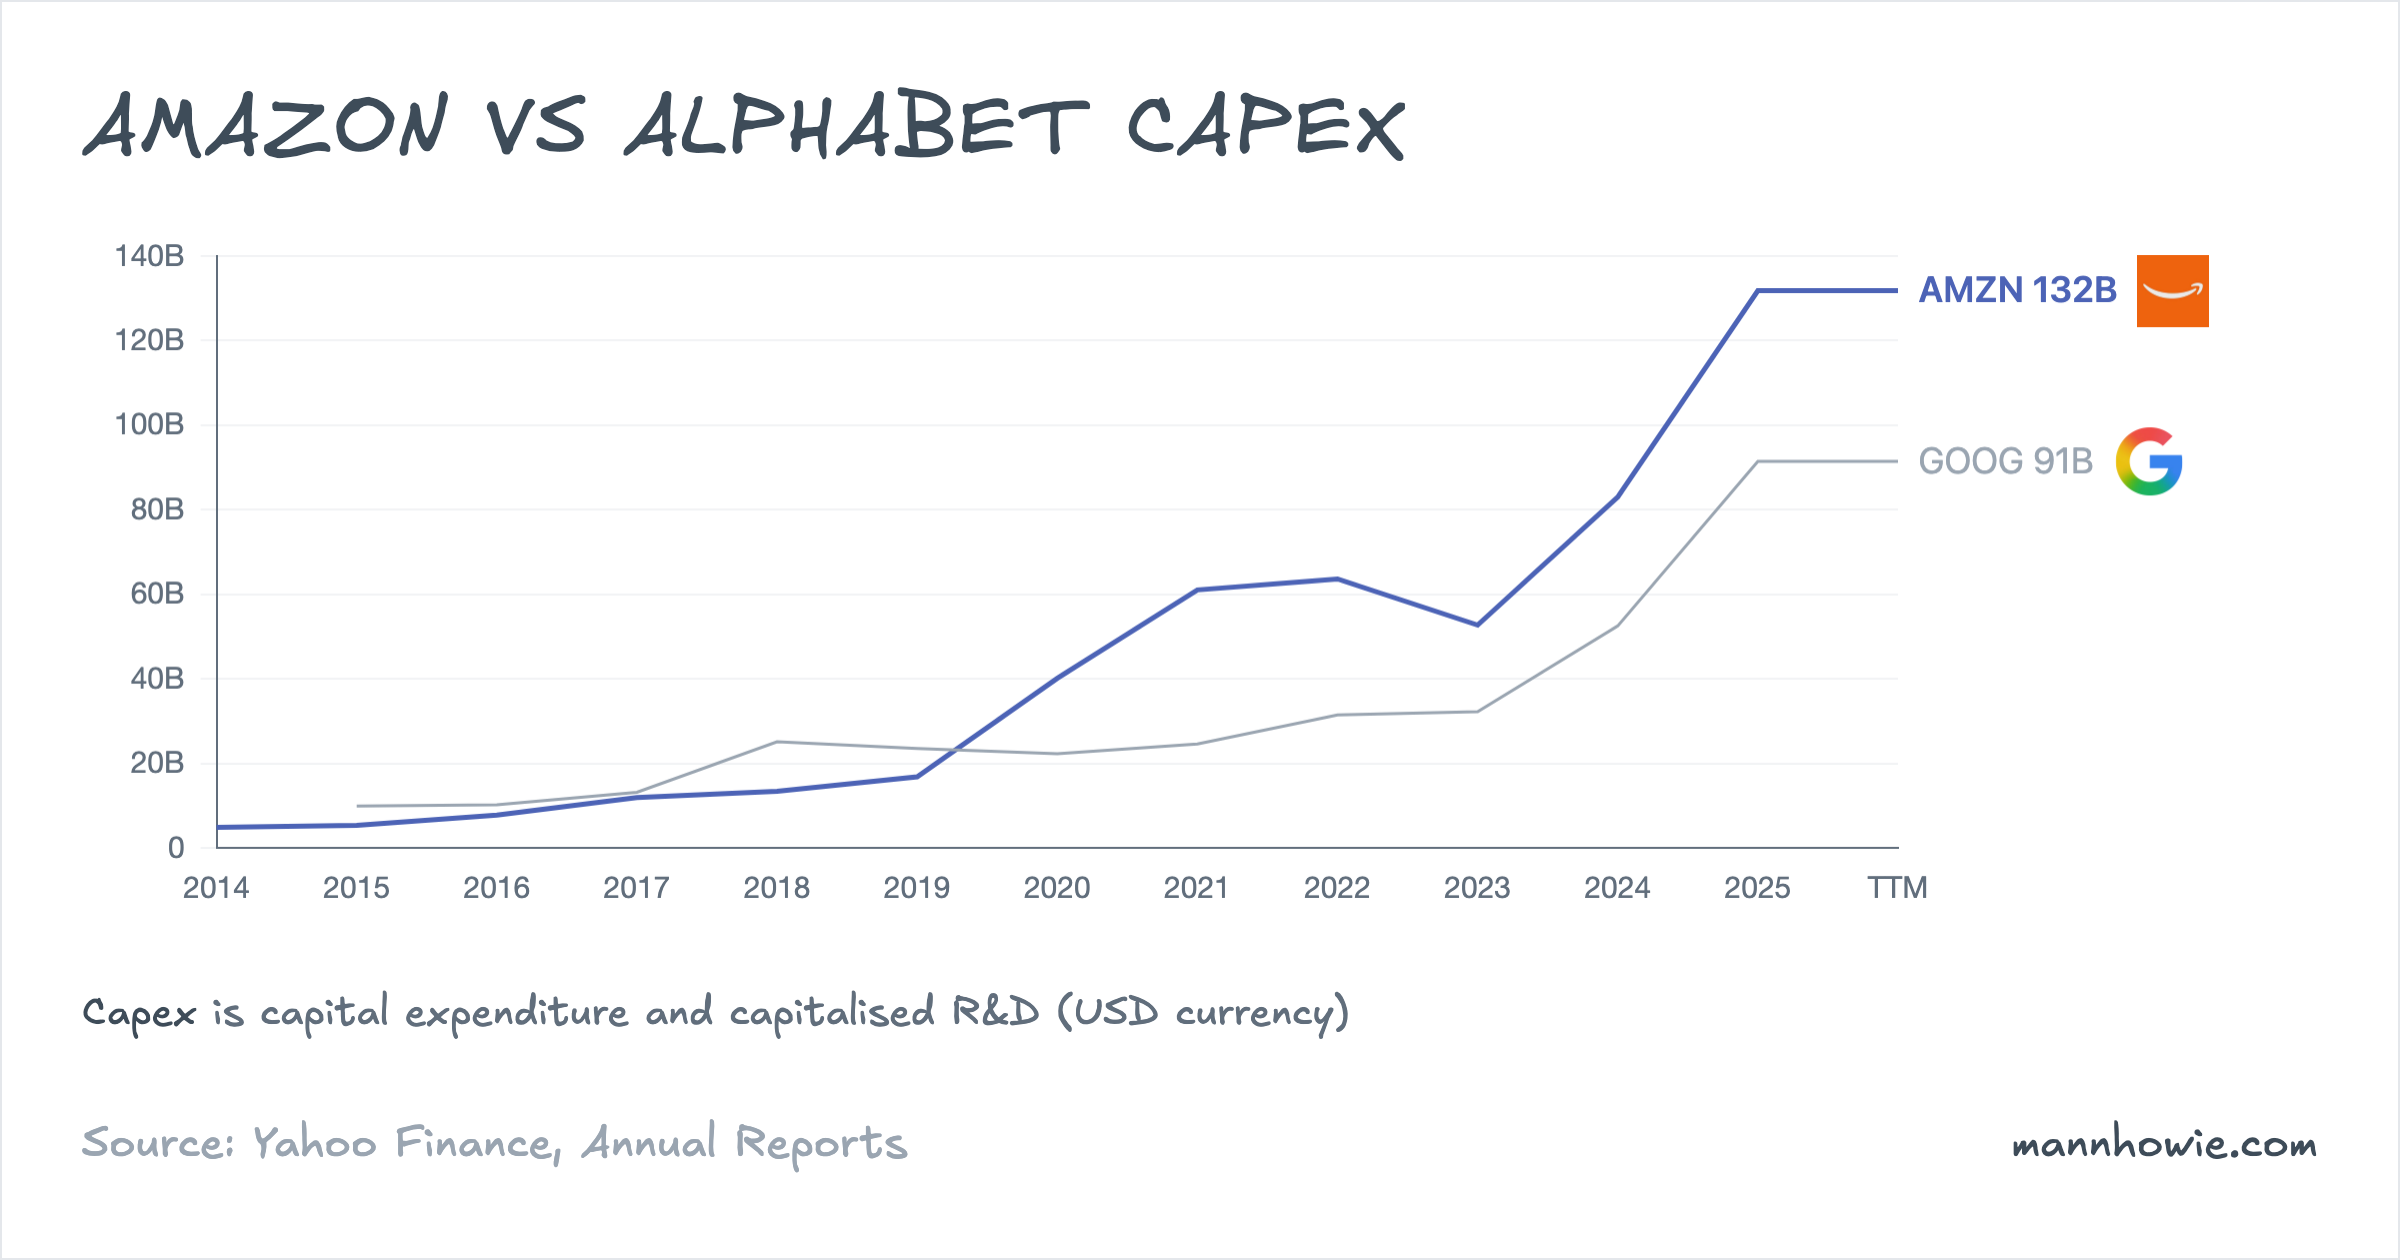
| Amazon | 63,645 | 52,729 | 82,999 | 131,819 | +$68B |
| Alphabet | 31,485 | 32,251 | 52,535 | 91,447 | +$60B |
Amazon’s capex has roughly doubled over three years; Alphabet’s has nearly tripled. Both sit well above depreciation and above operating cash flow growth, and both are being directed primarily at AI infrastructure: graphics processors, datacentre buildouts and long-dated power supply contracts. The scale of Amazon’s spend is why its trailing free cash flow is negative $11.8B despite $80B of EBIT.
“The way AWS’s cash cycle works is that the faster AWS grows, the more short-term capex we’ll spend… We are willing to make large capex investments and endure short-term FCF headwinds for the substantial medium to long-term FCF surplus.”
— Andy Jassy, Amazon 2025 CEO Letter
Two points are worth noting:
- Amazon’s 2025 capex of $132B is comparable to its TTM EBIT of $80B plus depreciation. Management has described the programme as AI-demand-led, with AWS revenue growth expected to rise as new capacity comes online.
- Alphabet’s $91B capex is funded out of a Google Services engine that continues to generate $139B of operating profit. Alphabet produced $48B of TTM free cash flow even after the capex bill; Amazon, on current figures, cannot.
Both firms have signed multi-year power and custom-silicon commitments. Amazon’s in-house chip line is Trainium; Alphabet’s is the TPU. Both initiatives are aimed at reducing dependence on Nvidia graphics processors and at extracting better performance per dollar on their own workloads. The returns on the 2024-2025 capex cycle will become visible in 2026 to 2028 as capacity is fully utilised and contract revenue is recognised.
Sources
- Amazon 10-K FY2024, pages 65–68 (segment revenue, segment operating income, net sales by product line).
- Amazon 10-K FY2025, pages 67–69 (segment revenue, segment operating income, net sales by product line).
- Alphabet 10-K FY2024, pages 63, 87–88 (revenue disaggregation, segment revenue, segment operating income).
- Alphabet 10-K FY2025, pages 60, 86–88 (revenue disaggregation, segment revenue, segment operating income).
- Andy Jassy, Amazon 2025 CEO Letter, April 9, 2026 (AWS cash cycle, capex philosophy).
- Sundar Pichai, Alphabet Founders’ Letter, April 28, 2016 (mobile-first to AI-first strategic pivot).