Netflix vs Disney: Streaming Margins, Park Profits and the Valuation Gap
10 minute read | Apr 18, 2026 | Reviewed by Howie Mann
Netflix streams television series, films and games to paying subscribers in over 190 countries. Revenue comes from monthly subscription fees and a growing advertising tier.
Disney operates theme parks, produces films and television, and runs streaming services including Disney+, Hulu and ESPN. Revenue comes from park admissions, streaming subscriptions, content licensing and linear television advertising.
Revenue
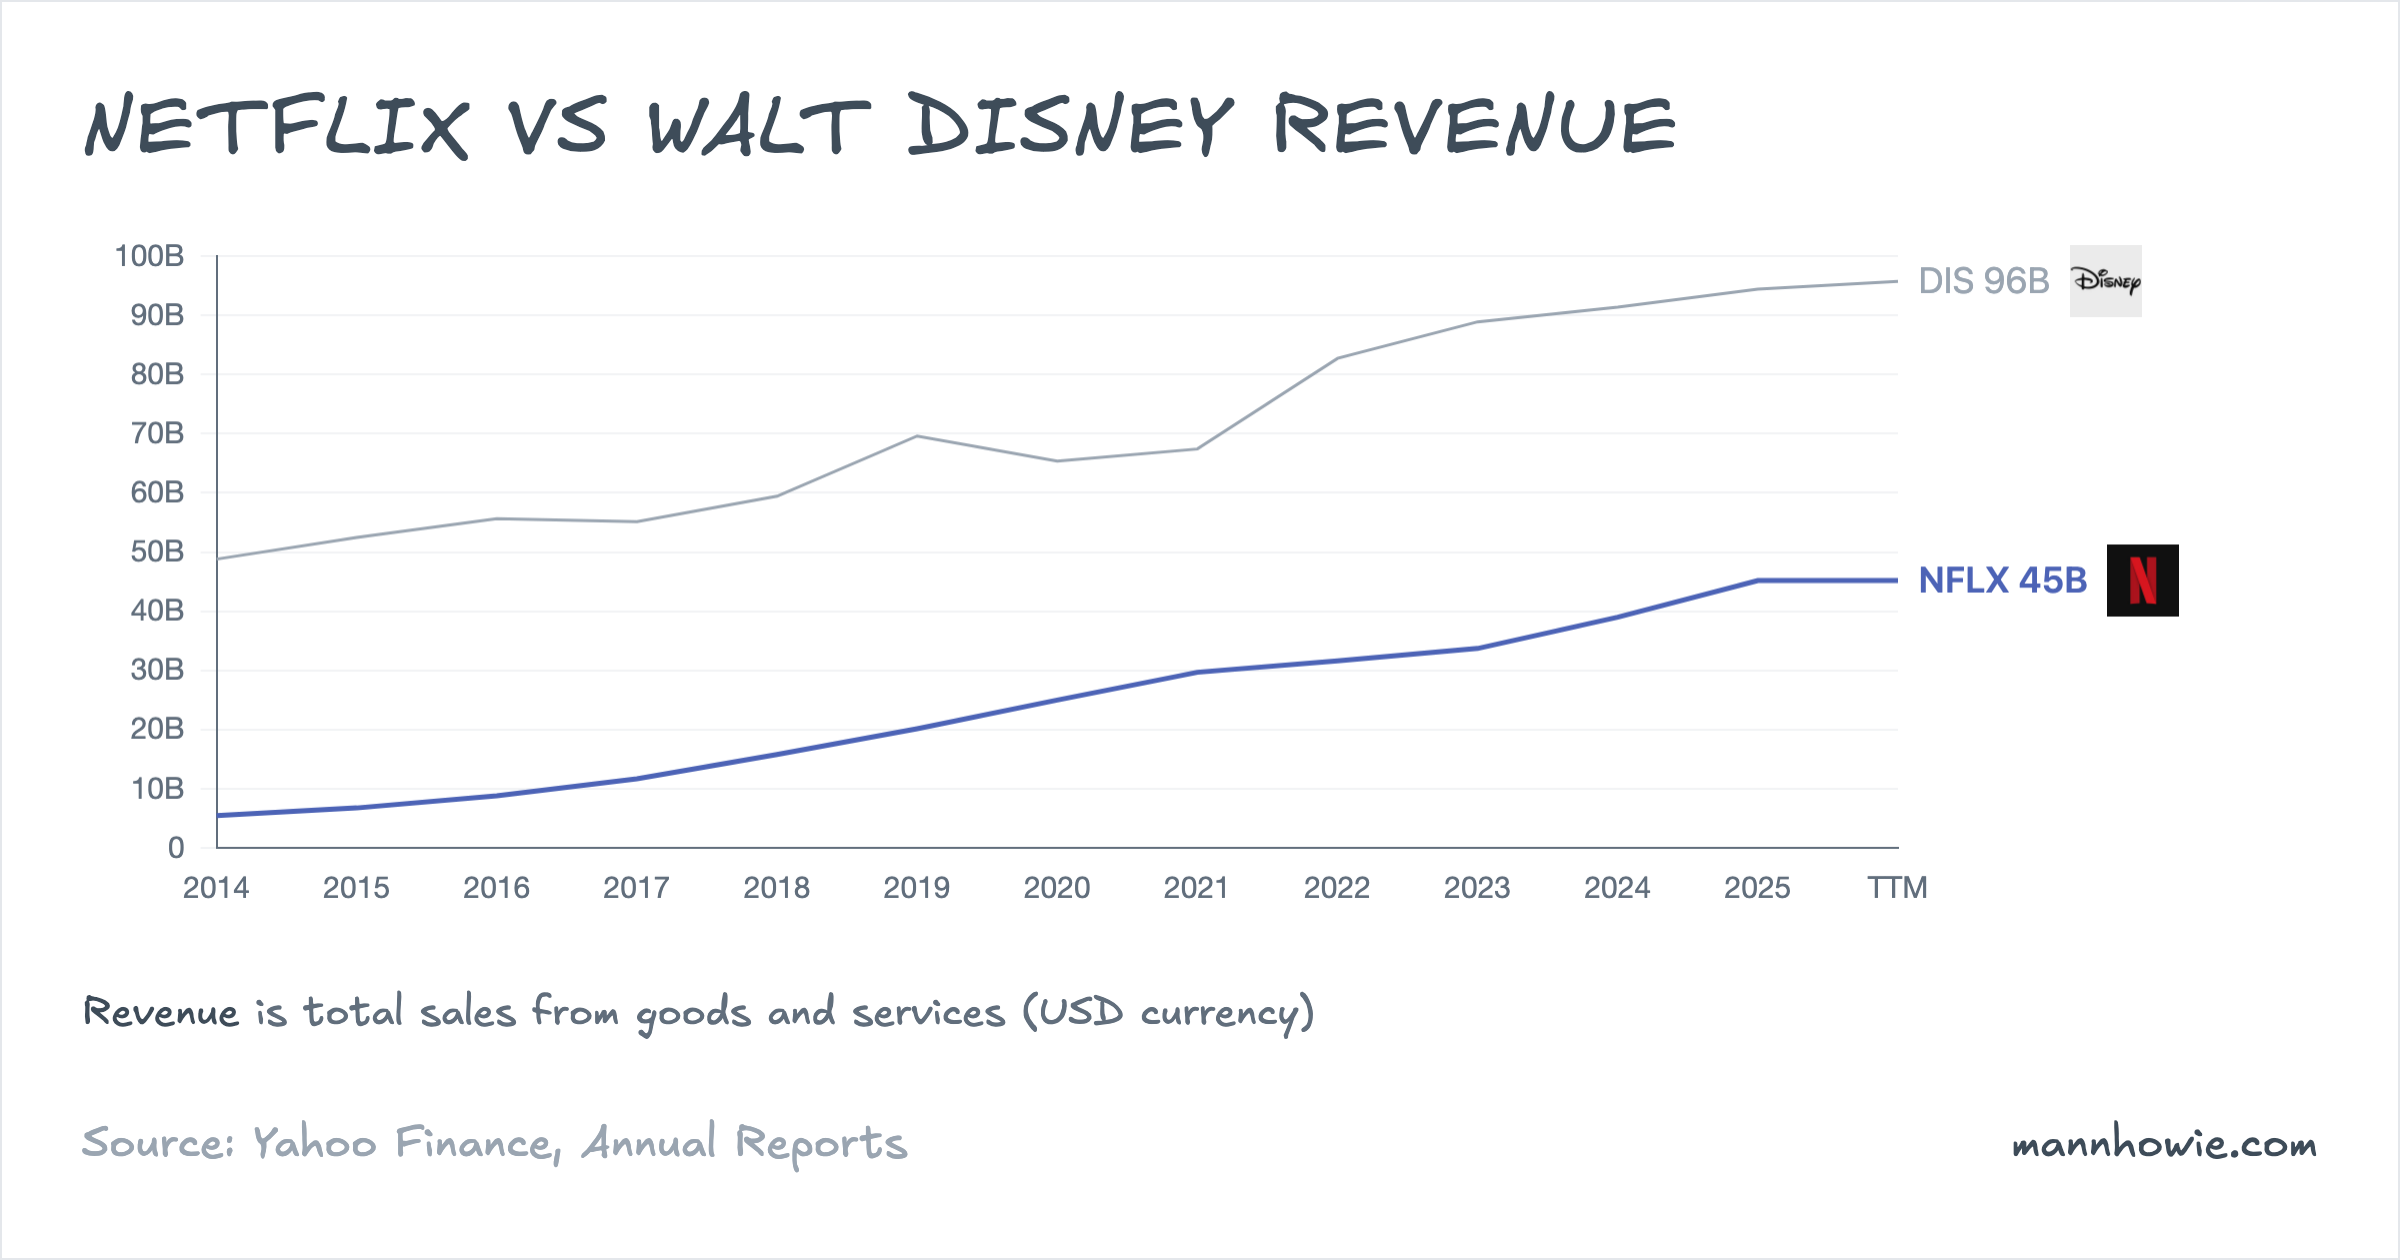
Disney’s revenue is roughly twice Netflix’s. Between FY2022 and FY2025, Disney added $11.7B at a 4.5% compound annual rate on an $82.7B base. Netflix grew faster at 12.6%, adding $13.6B on a $31.6B base. Netflix added more absolute revenue than Disney over three years despite starting at less than half the size.
The businesses overlap in streaming but diverge elsewhere. Netflix is a pure streaming company. Disney operates theme parks, cruise ships, linear television networks, a sports broadcaster (ESPN) and a film studio alongside its streaming services. That breadth explains the revenue gap but, as the EBIT section shows, not the profit gap.
Netflix: revenue by geography
Netflix operates as a single reportable segment. The geographic breakdown covers streaming revenue only; FY2022 total company revenue of $31.6B included $146M from the since-discontinued DVD business.
| Region (USD M) | FY2022 | FY2023 | FY2024 | FY2025 | % of FY25 | 3Y CAGR | 3Y Change ($) |
|---|---|---|---|---|---|---|---|
| United States and Canada | 14,085 | 14,874 | 17,359 | 19,957 | 44.2% | 12.3% | +5,872 |
| Europe, Middle East, Africa | 9,745 | 10,556 | 12,387 | 14,515 | 32.1% | 14.2% | +4,770 |
| Latin America | 4,070 | 4,446 | 4,840 | 5,358 | 11.9% | 9.6% | +1,288 |
| Asia-Pacific | 3,570 | 3,764 | 4,415 | 5,354 | 11.8% | 14.5% | +1,784 |
| Total streaming | 31,470 | 33,640 | 39,001 | 45,183 | 100% | 12.8% | +13,713 |
United States and Canada is the largest region at 44% of revenue and added the most absolute dollars at $5.9B. EMEA is the second-largest, adding $4.8B. Asia-Pacific posted the highest growth rate at 14.5% CAGR on a $3.6B base, adding $1.8B, driven by expansion in India, Japan and South Korea.
Netflix ended FY2024 with 302 million paid memberships globally. The company discontinued membership reporting in FY2025, shifting to revenue and operating margin as its primary metrics. Management has stated that Netflix accounts for roughly 5% of television viewing time globally and 7% of addressable revenue in its operating markets, implying a total addressable market of roughly $670B.
Netflix’s advertising tier, launched in late 2022, has reached roughly $3B in annualised revenue. The ad-supported plan lowers the entry price for subscribers while adding a second revenue stream on top of subscriptions. This dual monetisation model is a structural shift from the subscription-only economics that governed the first two decades of the business.
Disney: revenue by segment
| Segment (USD M) | FY2022 | FY2023 | FY2024 | FY2025 | % of FY25 | 3Y CAGR | 3Y Change ($) |
|---|---|---|---|---|---|---|---|
| Entertainment | 39,569 | 40,635 | 41,186 | 42,466 | 45.0% | 2.4% | +2,897 |
| Experiences | 28,085 | 32,549 | 34,151 | 36,156 | 38.3% | 8.8% | +8,071 |
| Sports | 17,270 | 17,111 | 17,619 | 17,672 | 18.7% | 0.8% | +402 |
| Eliminations | (1,179) | (1,397) | (1,595) | (1,869) | |||
| Total | 83,745 | 88,898 | 91,361 | 94,425 | 100% | 4.1% | +10,680 |
Entertainment, which houses Disney+, Hulu, linear TV networks and the film studio, is the largest segment by revenue but the slowest grower at 2.4% CAGR. Within Entertainment, Direct-to-Consumer (streaming) revenue grew from $19.9B to $24.6B over FY2023 to FY2025, while Linear Networks declined from $11.7B to $9.4B as cord-cutting accelerated. Experiences added the most absolute revenue at $8.1B, driven by theme park admissions and resort spending. Sports (ESPN) was essentially flat.
Disney’s Experiences segment, which includes Disneyland, Walt Disney World, international parks and a growing cruise line fleet, is the company’s most consistent growth driver. CEO Josh D’Amaro described FY2025 as being “driven by the largest capital investment plan in Disney Experiences history,” with new lands opening in Paris, expansions in California and Florida, and the first Disney cruise ship based in Asia.
EBIT and margins
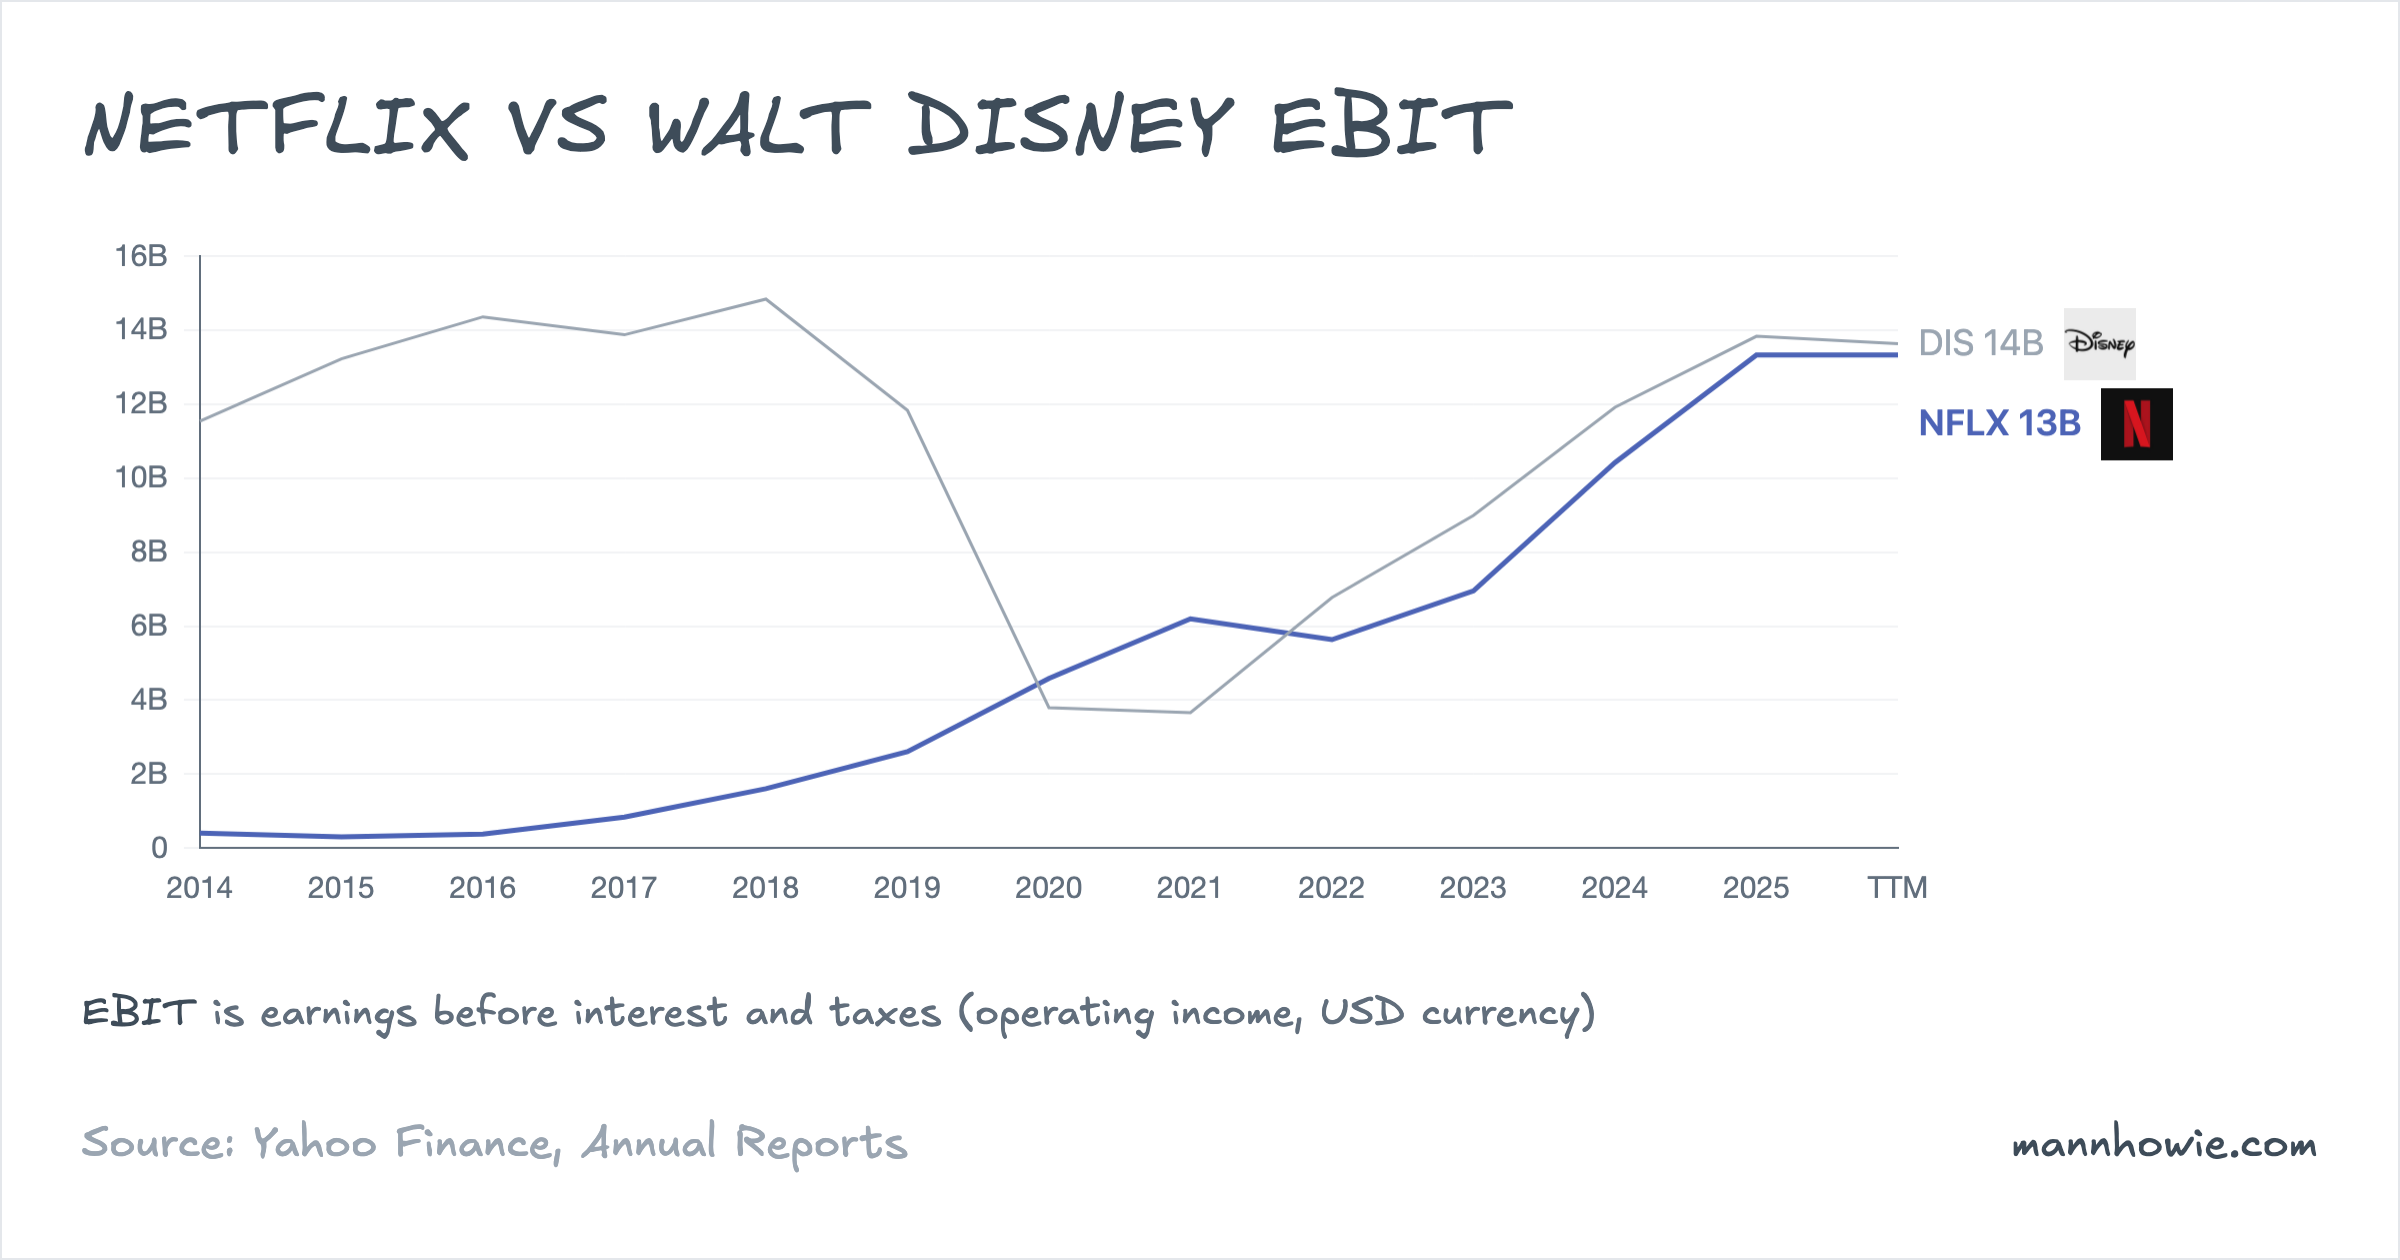
Disney generates roughly twice the revenue. Both companies earn about the same operating profit.
| Metric (TTM) | Netflix | Disney | Gap |
|---|---|---|---|
| Revenue | $45.2B | $95.7B | DIS +112% |
| EBIT | $13.3B | $13.6B | ~parity |
| Operating margin | 29.5% | 14.2% | NFLX +15.3 pp |
| ROIC | 35.2% | 9.8% | NFLX +25.4 pp |
| Gross margin | 48.5% | 37.3% | NFLX +11.2 pp |
Netflix converts nearly 30 cents of every revenue dollar into operating profit. Disney converts about 14 cents. The gap reflects business model differences: Netflix runs a software distribution platform with high incremental margins on each additional subscriber. Disney bears the physical costs of operating theme parks, cruise ships and a linear broadcast infrastructure alongside its streaming and studio businesses.
The ROIC gap is wider still. Netflix generates a 35% return on invested capital; Disney generates 10%. Netflix’s asset base is dominated by content (a depreciating intangible), while Disney carries $50B+ of theme park property and goodwill from the 21st Century Fox acquisition.
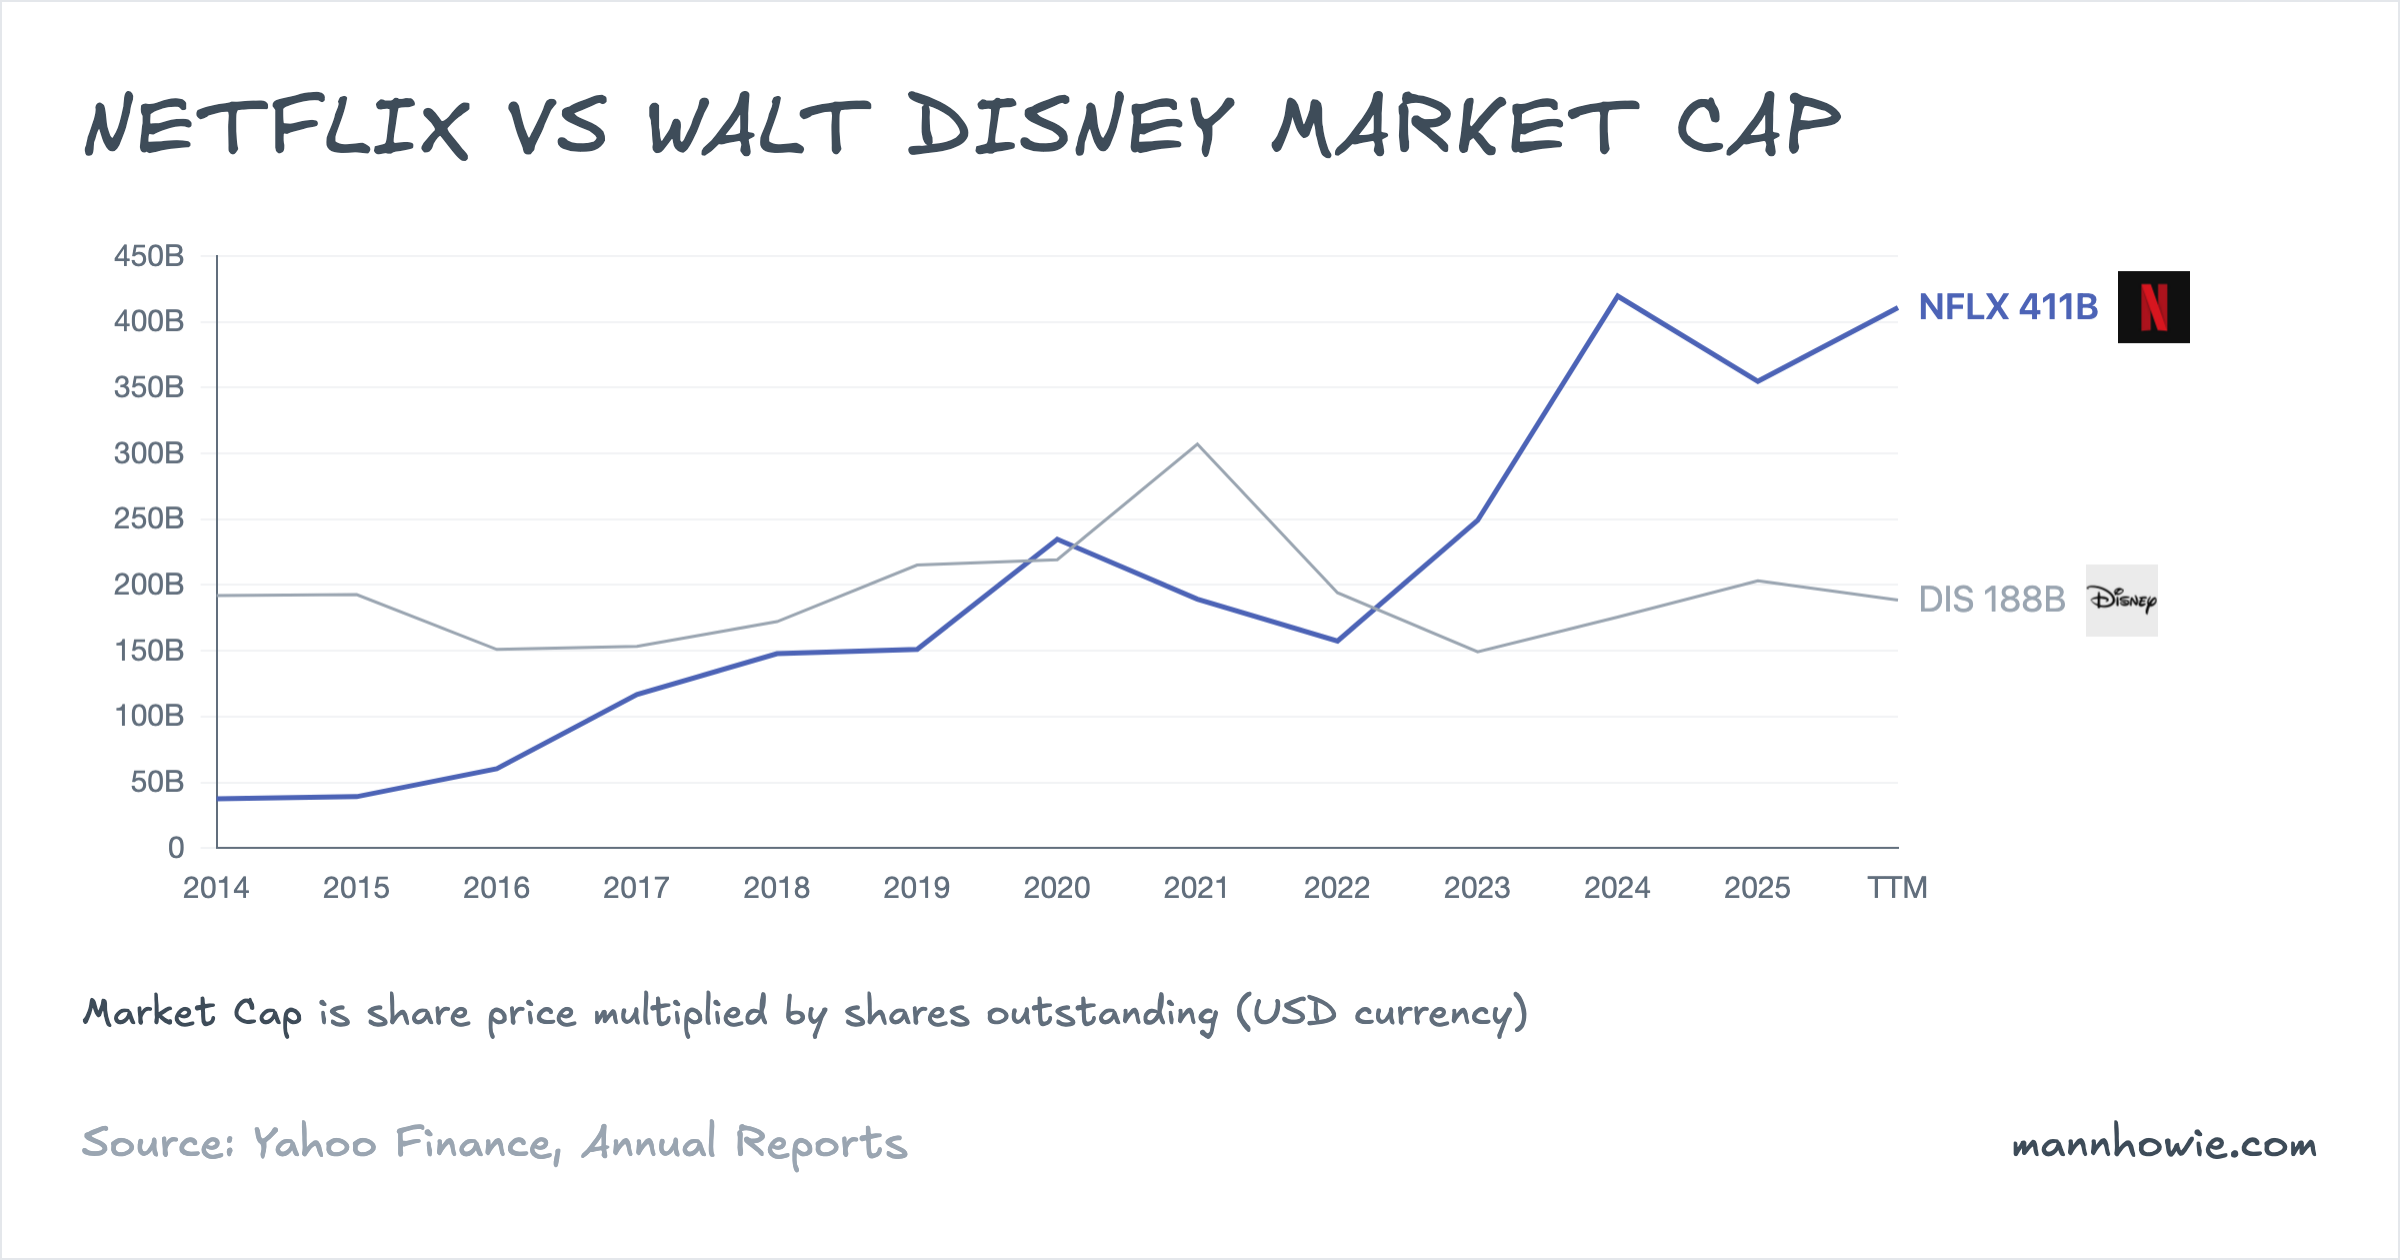
Equity markets value Netflix at $411B and Disney at $188B. Netflix trades at a P/E of 37x versus Disney’s 15x, and an EV/EBIT of 31x versus 17x. The gap reflects the difference in margin trajectory and capital intensity.
Netflix: operating margin trajectory
| Metric | FY2022 | FY2023 | FY2024 | FY2025 |
|---|---|---|---|---|
| Revenue (USD M) | 31,616 | 33,723 | 39,001 | 45,183 |
| Operating income (USD M) | 5,633 | 6,954 | 10,418 | 13,327 |
| Operating margin | 17.8% | 20.6% | 26.7% | 29.5% |
Netflix’s operating margin has nearly doubled in three years. Revenue grew 43% while content amortisation (the largest cost line at $16.4B in FY2025) grew 17%. The operating leverage stems from content costs that do not scale linearly with subscriber growth: the same title serves 300 million members as easily as 230 million. Management has guided for a 31.5% operating margin in 2026.
Netflix added $17.1B of new content assets in FY2025, up from $16.8B in FY2022. This is the company’s equivalent of capital expenditure. Traditional capex (servers, offices) was $688M, roughly 1.5% of revenue.
Disney: segment EBIT
| Segment (USD M) | FY2022 | FY2023 | FY2024 | FY2025 | % of FY25 EBIT | 3Y CAGR | 3Y Change ($) |
|---|---|---|---|---|---|---|---|
| Experiences | 7,285 | 8,954 | 9,272 | 9,995 | 72.3% | 11.1% | +2,710 |
| Entertainment | 2,126 | 1,444 | 3,923 | 4,674 | 33.8% | 30.1% | +2,548 |
| Sports | 2,710 | 2,465 | 2,406 | 2,882 | 20.9% | 2.1% | +172 |
| Corporate and unallocated | (5,351) | (3,871) | (3,687) | (3,719) | -26.9% | n/m | +1,632 |
| Total | 6,770 | 8,992 | 11,914 | 13,832 | 100% | 26.8% | +7,062 |
Experiences generates 72% of Disney’s operating profit at a 27.7% margin on $36B of revenue. The segment added $2.7B over three years and has delivered operating income above $7B in every year of the period. It is the financial anchor of the company.
Entertainment added the most absolute operating profit at $2.5B, driven by a swing in Direct-to-Consumer from a $2.5B loss in FY2023 to a $1.3B profit in FY2025. Disney’s streaming services reached profitability in FY2024 after years of losses during subscriber acquisition. Linear Networks continued to decline, falling from $4.1B to $3.0B of operating income as advertising migrated to digital platforms.
Corporate and unallocated costs of $3.7B include amortisation of intangible assets from the 21st Century Fox acquisition and restructuring charges. These costs declined from $5.4B in FY2022 as one-time restructuring items wound down but will persist at roughly this level due to ongoing Fox-related amortisation.
Free cash flow
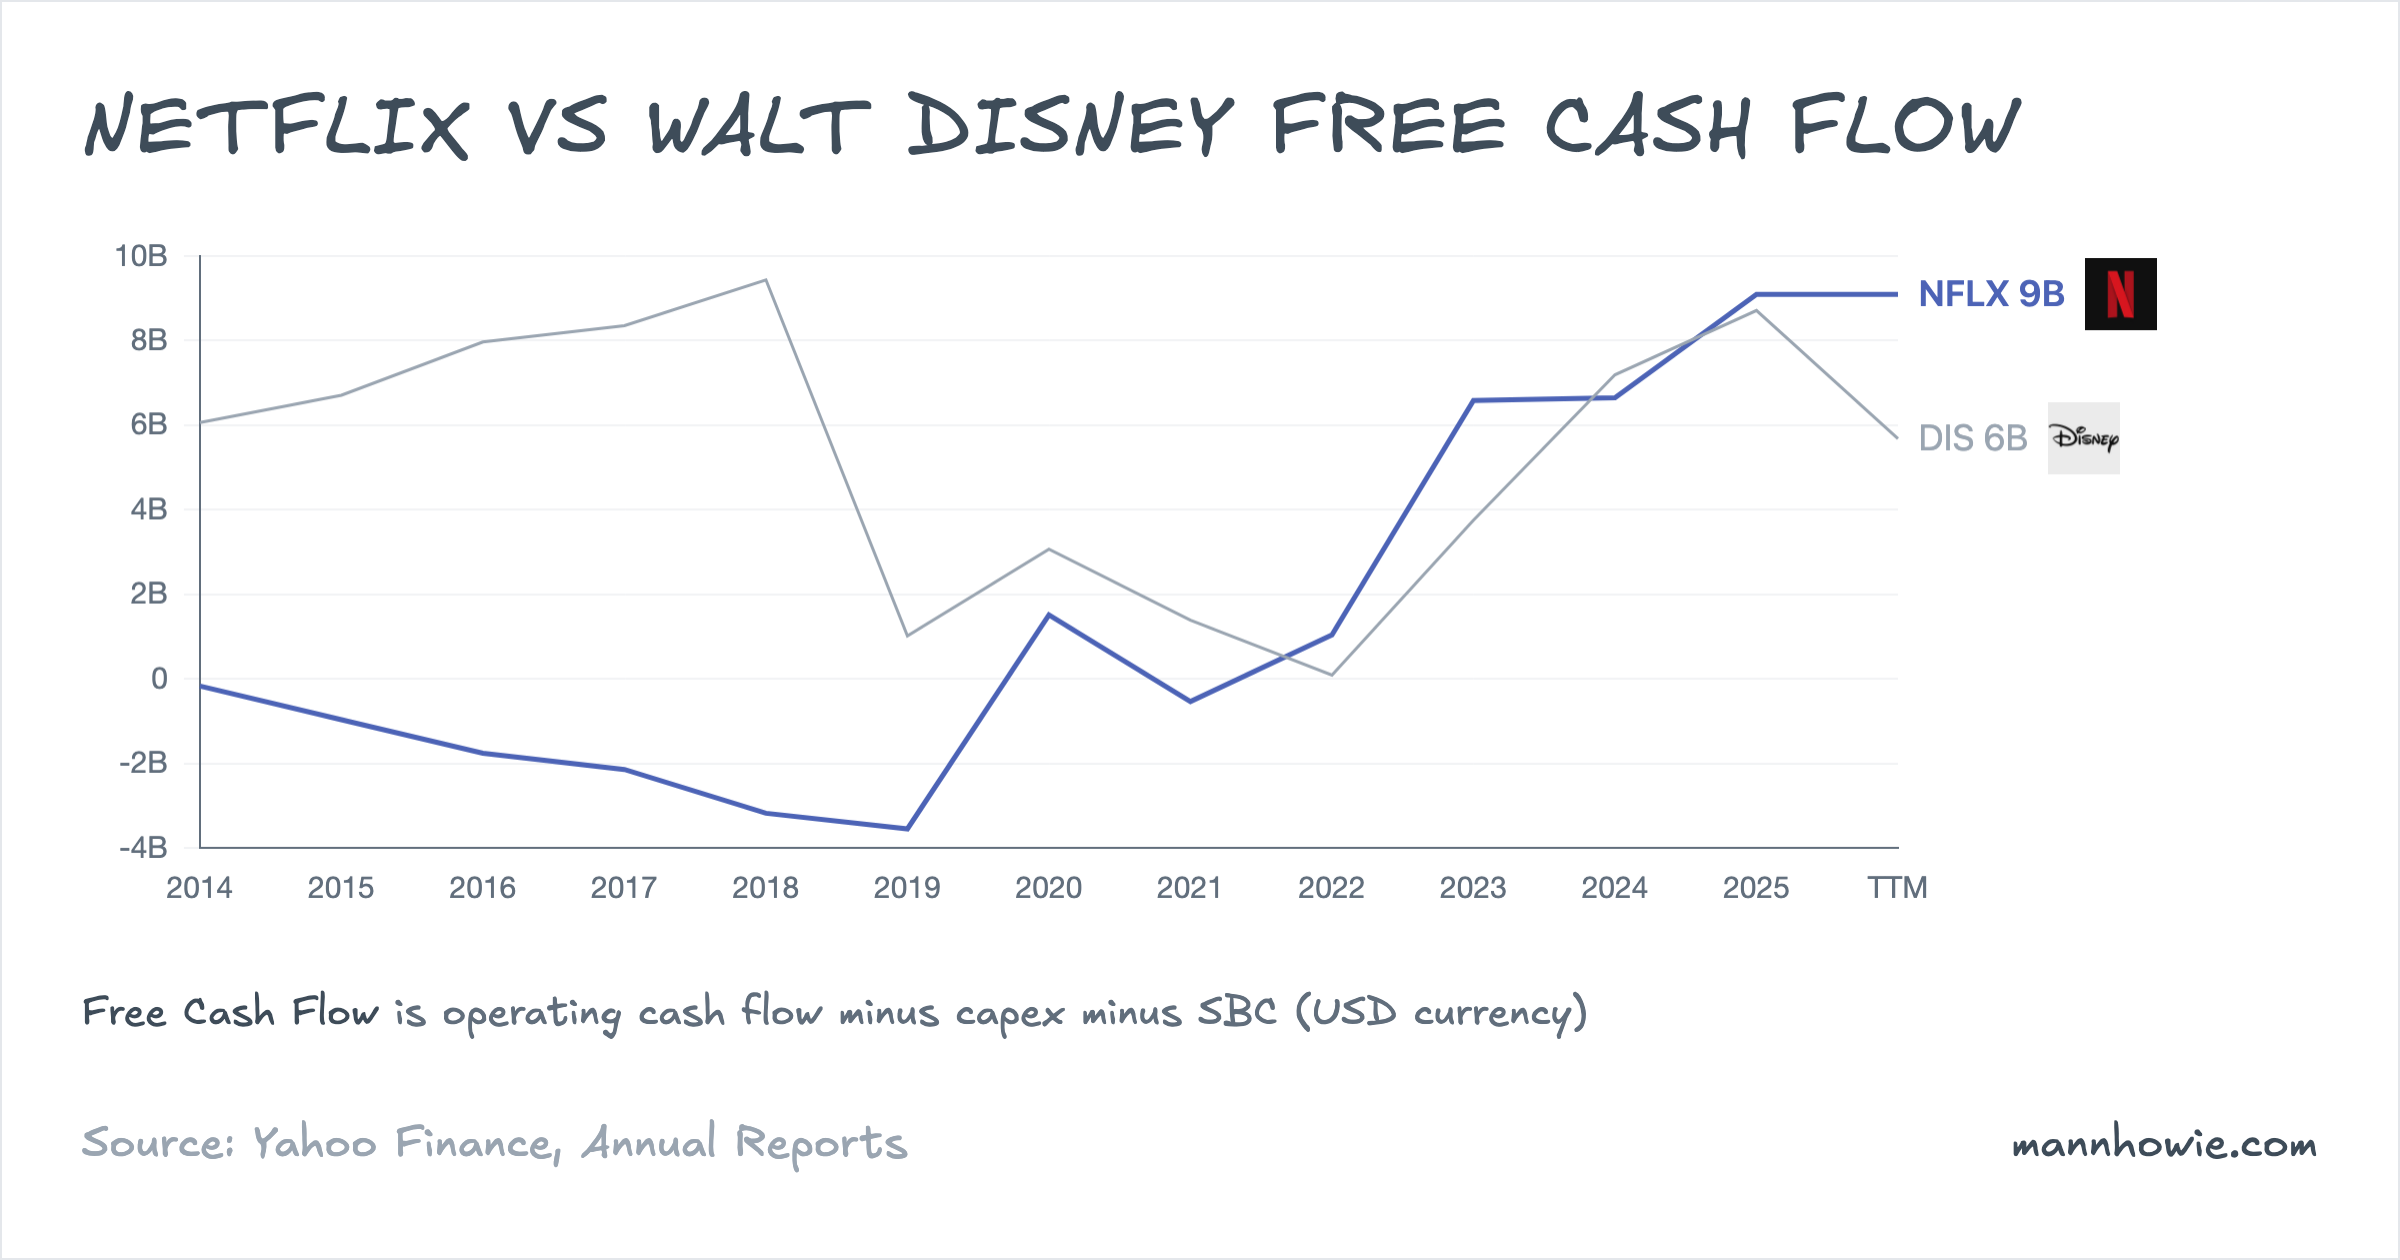
For the decade through 2019, Netflix was the cash-incinerator of entertainment. It burned $11.6B of cumulative free cash flow from FY2015 to FY2019 funding a library that could compete with the studios. Disney, across the same years, threw off $33.5B. The two lines crossed in FY2023. In FY2025, Netflix generated $9.1B of free cash flow. Disney generated $8.7B.
| FCF (USD M) | Netflix | Disney |
|---|---|---|
| FY2018 | -3,175 | 9,437 |
| FY2019 | -3,545 | 1,019 |
| FY2020 | 1,514 | 3,071 |
| FY2021 | -535 | 1,389 |
| FY2022 | 1,043 | 90 |
| FY2023 | 6,586 | 3,754 |
| FY2024 | 6,648 | 7,193 |
| FY2025 | 9,093 | 8,714 |
The crossover is about how content cash gets paid, not how it gets expensed.
Netflix pays cash upfront for original content. Those payments flow through operating cash flow as additions to content assets, then get amortised over years into the income statement. In FY2018, Netflix reported $1.2B of net income but burned $2.7B in operating cash flow — the $3.9B wedge was cash spent on content that had not yet hit the P&L. As long as Netflix was doubling its library each year, reported earnings and cash moved in opposite directions.
By FY2025, revenue had grown from $15.8B to $45.2B while content cash spend stabilised around $17B per year. Net income and operating cash flow converged: $11.0B reported, $10.1B cash. Traditional capex (servers, offices) is a rounding error at $688M. The bull case on Netflix is that content spend now grows roughly with revenue rather than ahead of it, which means operating leverage compounds directly into FCF.
Disney ran the other way. FY2018 was a $9.4B FCF high watermark built on a $14.3B operating cash flow base. Then three things compressed cash: (1) the $71B Fox acquisition in March 2019 loaded up content commitments and sports rights; (2) COVID shuttered the theme parks through FY2020 and FY2021; and (3) Disney+ hit subscriber scale without profit — the Direct-to-Consumer segment lost $2.5B in FY2023 alone. FCF bottomed at $90M in FY2022.
Both companies now sit near $9B of annual FCF, but with opposite momentum. Netflix has guided a 31.5% operating margin for 2026, with content spend tracking revenue. Disney’s pressure runs the other way: the company has committed $60B of Experiences investment over the next decade, which will keep capex well above the $4B-$5B baseline of the pre-2022 period.
“All around the world, we’re building new adventures and expanding capacity to welcome more families into our uniquely Disney experiences, driven by the largest capital investment plan in Disney Experiences history.”
— Josh D’Amaro, Disney 2026 Annual Meeting of Shareholders
Sources
- Netflix 10-K FY2024, pages 19–21, 37, 39 (geographic revenue, operating income, content assets).
- Netflix 10-K FY2025, pages 20–21, 39, 41 (geographic revenue, operating income, content assets).
- Disney 10-K FY2024, pages 36–47, 79 (segment revenue, segment operating income, sub-segment detail).
- Disney 10-K FY2025, pages 36–47, 78 (segment revenue, segment operating income, sub-segment detail).
- Netflix Q1 2026 Earnings Call, April 16, 2026 (addressable market, margin guidance).
- Josh D’Amaro, Disney 2026 Annual Meeting of Shareholders, March 18, 2026 (Experiences capital investment).