NVIDIA vs AMD: the AI stack and the catch-up
10 minute read | Apr 19, 2026 | Reviewed by Howie Mann
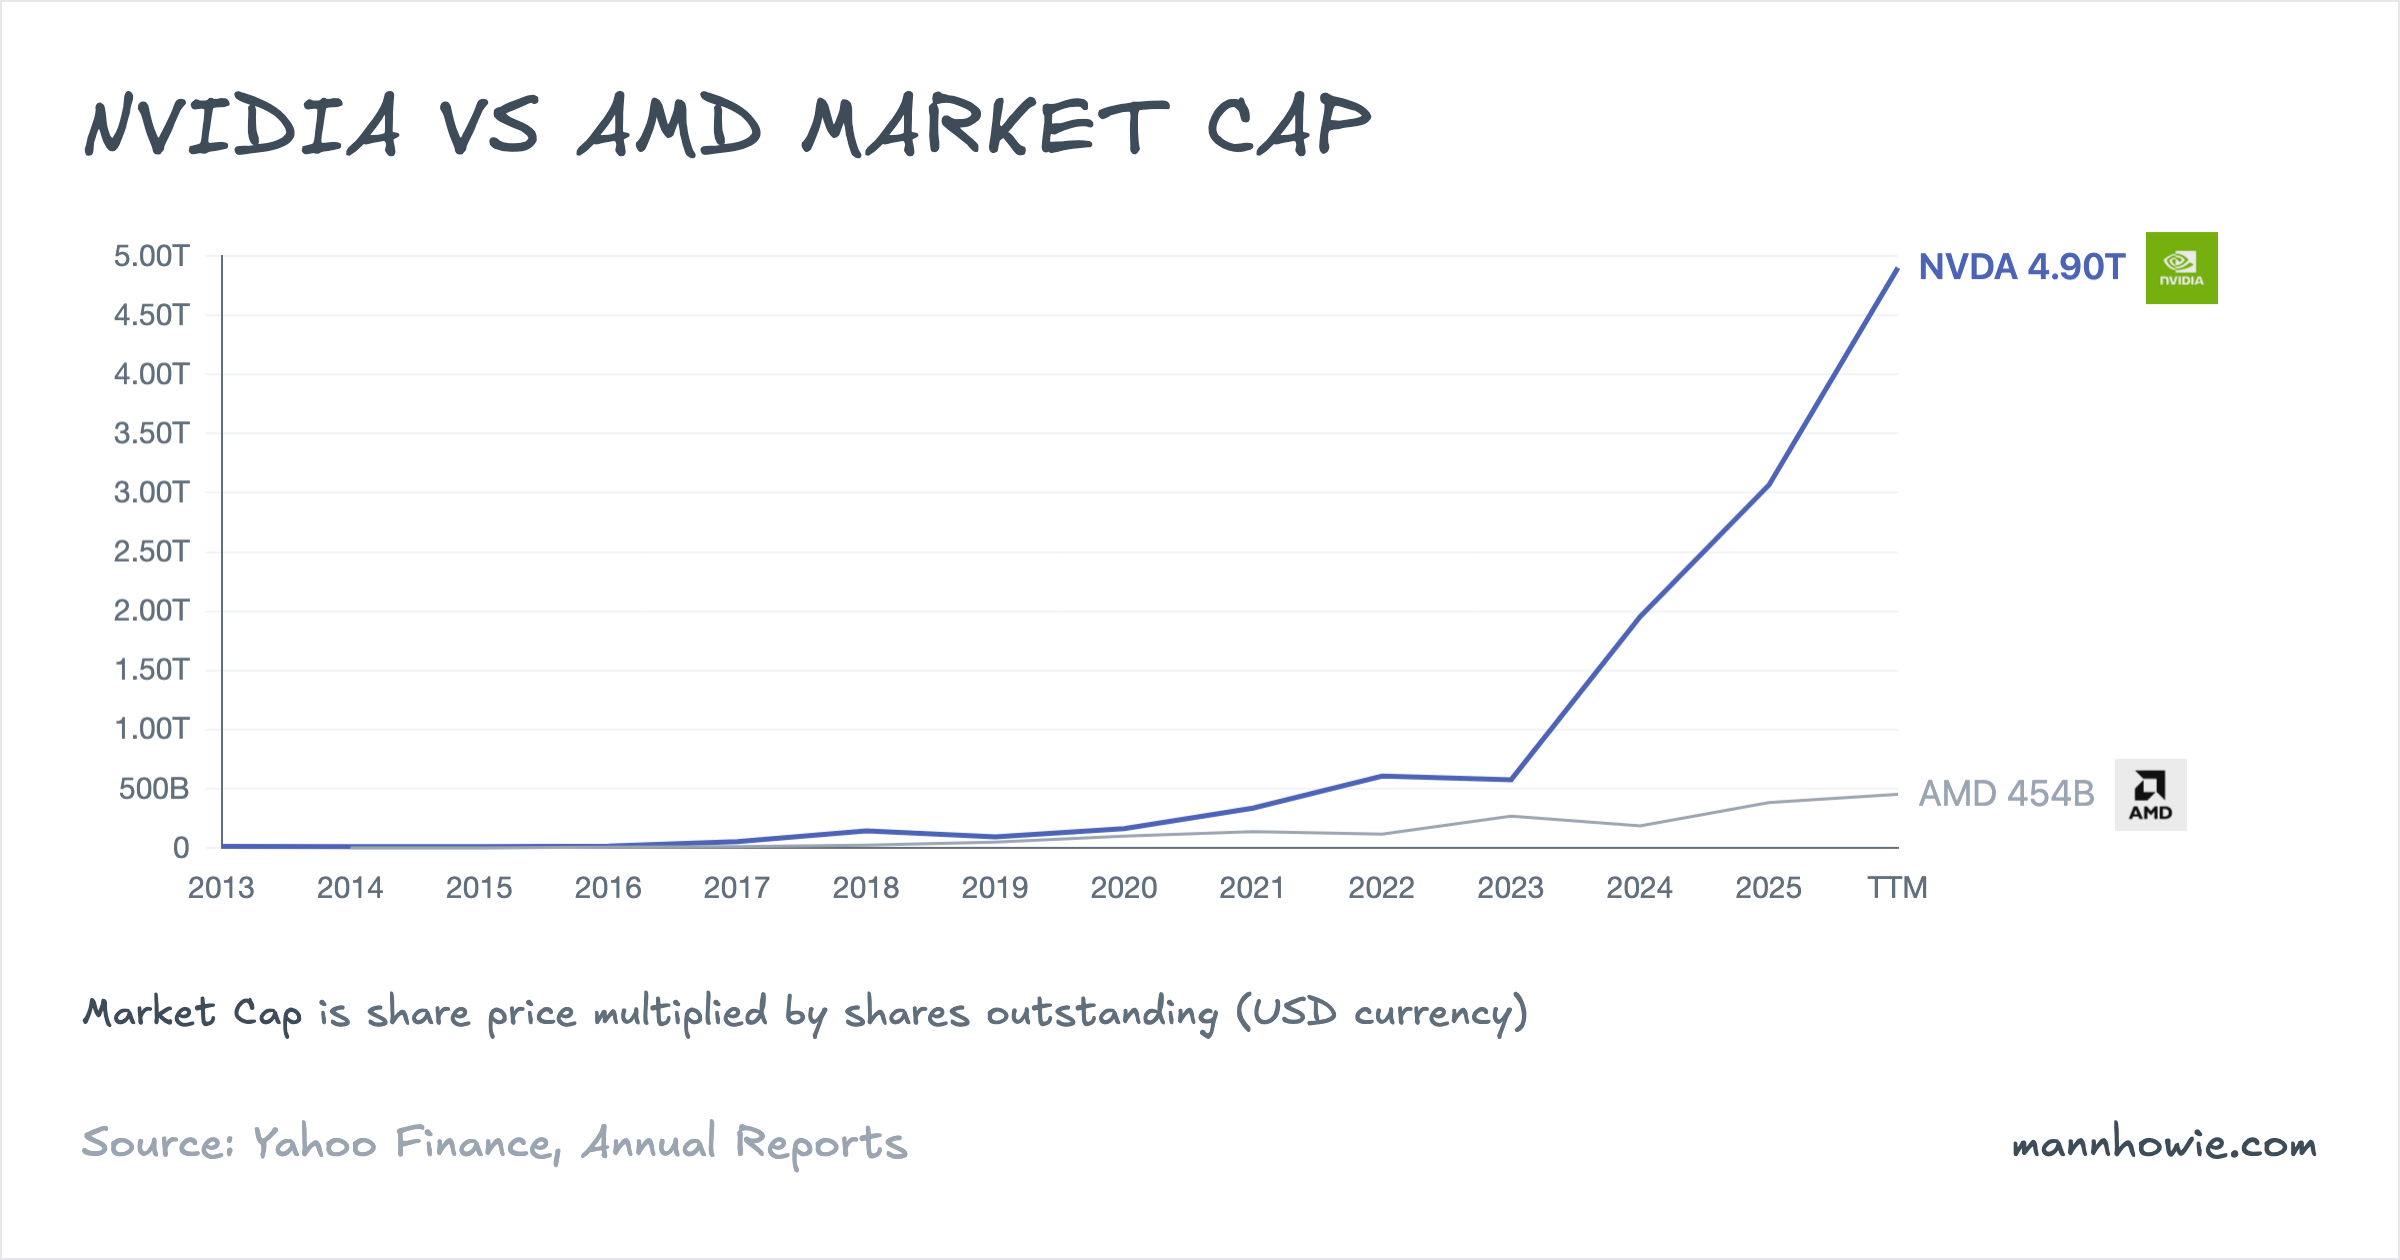
NVIDIA designs GPUs and the networking, CPUs and software that bind them into AI infrastructure. Data Center supplies 90% of revenue; Gaming, Professional Visualization, Automotive and OEM divide the rest.
AMD designs CPUs and GPUs for servers, PCs, game consoles and embedded devices. Revenue splits across Data Center (EPYC server CPUs, Instinct AI accelerators), Client (Ryzen CPUs), Gaming (console and Radeon GPUs) and Embedded (Xilinx FPGAs).
Revenue
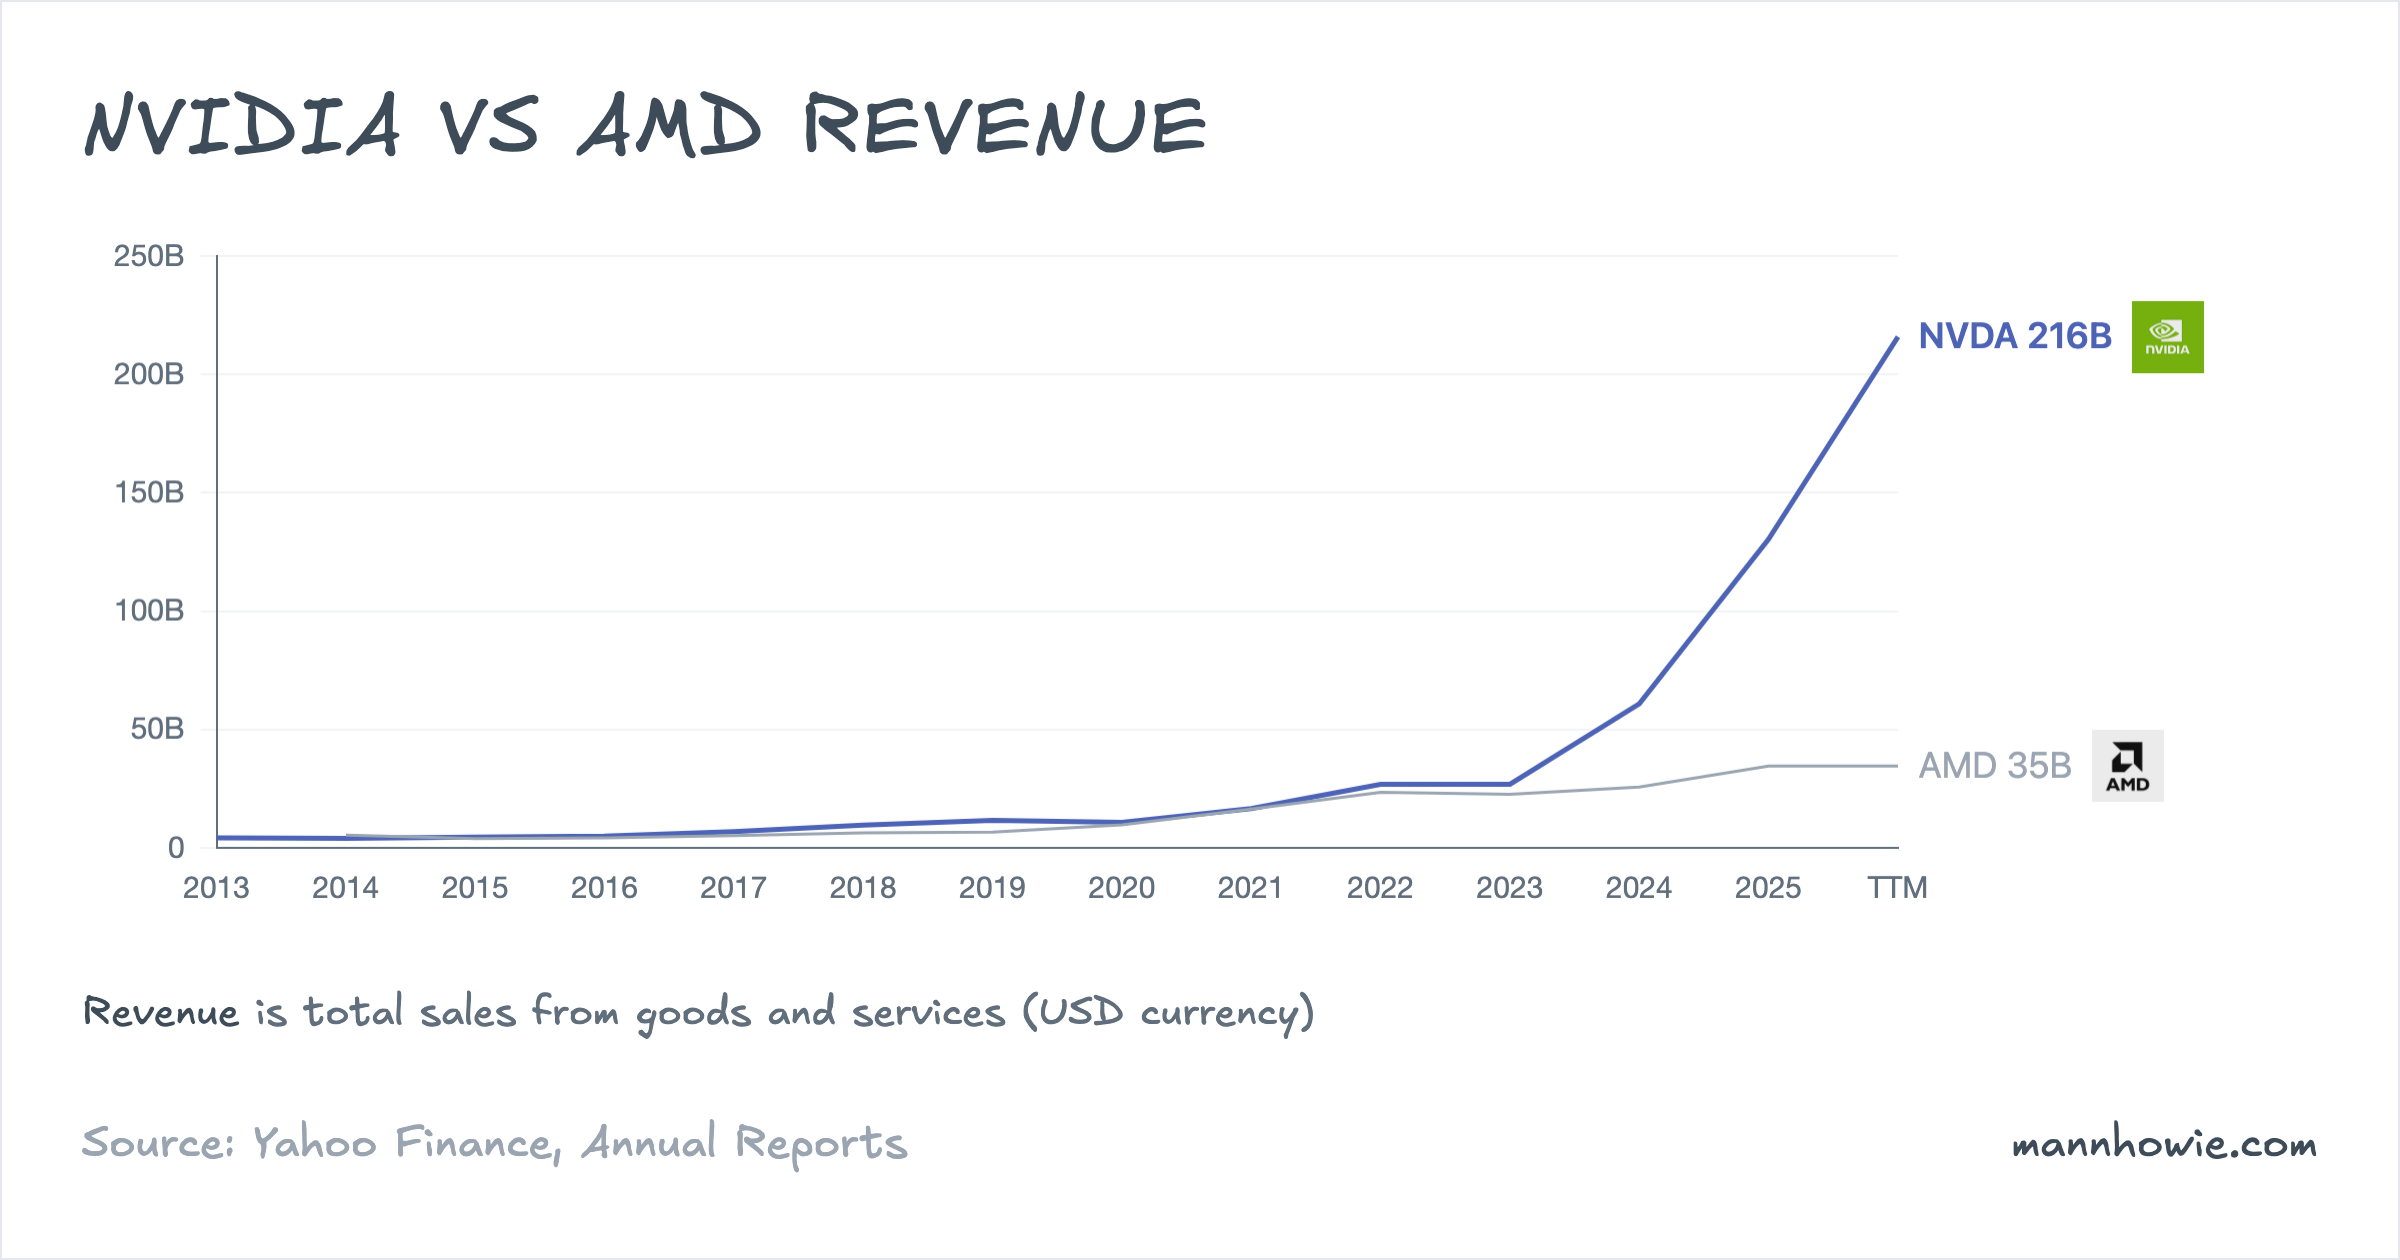
Three years ago the two companies were close. NVIDIA posted $27.0B in FY2023; AMD posted $23.6B in FY2022. By their most recent fiscal years NVIDIA had reached $215.9B and AMD $34.6B. NVIDIA added $189B against AMD’s $11B — seventeen dollars of NVIDIA growth for every dollar of AMD growth. Compound annual rates: 100% versus 14%.
The mechanism is a stack that was ready for the AI wave and one that was not. ChatGPT launched in November 2022. Hyperscaler capex redirected toward AI training and inference over the following four quarters. NVIDIA arrived with a full vertical already shipping at volume: GPUs, the CUDA software platform, the Mellanox networking business acquired in 2020, and DGX and HGX reference systems hyperscalers could deploy largely as-is. AMD’s first competitive AI accelerator, the MI300X, shipped a year later in December 2023. Its software platform, ROCm, had narrower third-party adoption than CUDA. It had no in-house networking business. The three-year numbers reflect those starting conditions.
NVIDIA: revenue by market platform
NVIDIA reports revenue by specialised market across five end-market platforms.
| Market platform (USD M) | FY2023 | FY2024 | FY2025 | FY2026 | % of FY26 | 3Y CAGR | 3Y Change ($) |
|---|---|---|---|---|---|---|---|
| Data Center | 15,005 | 47,525 | 115,186 | 193,737 | 89.7% | 135% | +178,732 |
| Gaming | 9,067 | 10,447 | 11,350 | 16,042 | 7.4% | 21% | +6,975 |
| Professional Visualization | 1,544 | 1,553 | 1,878 | 3,191 | 1.5% | 27% | +1,647 |
| Automotive | 903 | 1,091 | 1,694 | 2,349 | 1.1% | 38% | +1,446 |
| OEM & Other | 455 | 306 | 389 | 619 | 0.3% | 11% | +164 |
| Total revenue | 26,974 | 60,922 | 130,497 | 215,938 | 100% | 100% | +188,964 |
Data Center carries almost the whole franchise at 90% of FY2026 revenue and added $179B in three years — more than fifteen times the sum of every other platform’s growth.
The bundling story shows up inside Data Center. From FY2025 NVIDIA splits Compute from Networking. Compute reached $162.4B in FY2026; Networking reached $31.4B. Networking was effectively zero four years ago. Hyperscalers no longer buy chips and assemble their own clusters; they buy GPU nodes tied together with NVIDIA’s fabric, increasingly at full-rack scale. Revenue capture per unit of compute has widened.
Customer concentration has intensified alongside the spend. Two direct customers accounted for 36% of FY2026 revenue (one at 22%, one at 14%), up from a single customer at 13% in FY2024. A sovereign AI revenue line exceeded $30B in FY2026, reflecting national build-outs across several Western countries. China Data Center revenue fell to approximately zero following US export controls on H20 products.
AMD: revenue by segment
AMD reports net revenue across four segments.
| Segment (USD M) | FY2022 | FY2023 | FY2024 | FY2025 | % of FY25 | 3Y CAGR | 3Y Change ($) |
|---|---|---|---|---|---|---|---|
| Data Center | 6,043 | 6,496 | 12,579 | 16,635 | 48.0% | 40% | +10,592 |
| Client | 6,201 | 4,651 | 7,054 | 10,640 | 30.7% | 20% | +4,439 |
| Gaming | 6,805 | 6,212 | 2,595 | 3,910 | 11.3% | -17% | -2,895 |
| Embedded | 4,552 | 5,321 | 3,557 | 3,454 | 10.0% | -9% | -1,098 |
| Total revenue | 23,601 | 22,680 | 25,785 | 34,639 | 100% | 14% | +11,038 |
Data Center crossed half of AMD’s revenue for the first time in FY2025 at 48%, adding $10.6B — essentially all of group revenue growth. At $16.6B it is roughly a twelfth the size of NVIDIA’s Data Center at $193.7B. Same demand wave, different starting conditions.
The two legacy segments held the group number back. Gaming fell at 17% compound annual as Sony and Microsoft console volumes rolled off from the FY2022 peak; AMD has guided for another double-digit decline in FY2026 as the console cycle enters its seventh year. Embedded (Xilinx) peaked in FY2023 at $5.3B and fell on industrial and communications destocking.
Two forward commitments frame the next phase. In March 2025 AMD acquired ZT Systems to bring rack-scale integration in-house — the missing piece against NVIDIA’s DGX/HGX. In October 2025 it signed a multi-year 6-gigawatt Instinct GPU deal with OpenAI, beginning with MI450 on the Helios rack-scale platform, due in the second half of 2026.
“In addition to our multi-generation partnership with OpenAI to deploy 6 gigawatts of Instinct GPUs, we are in active discussions with other customers on at scale multi-year deployments, starting with Helios and MI450 later this year.”
— Lisa Su, AMD Q4 FY2025 earnings call
EBIT and margins
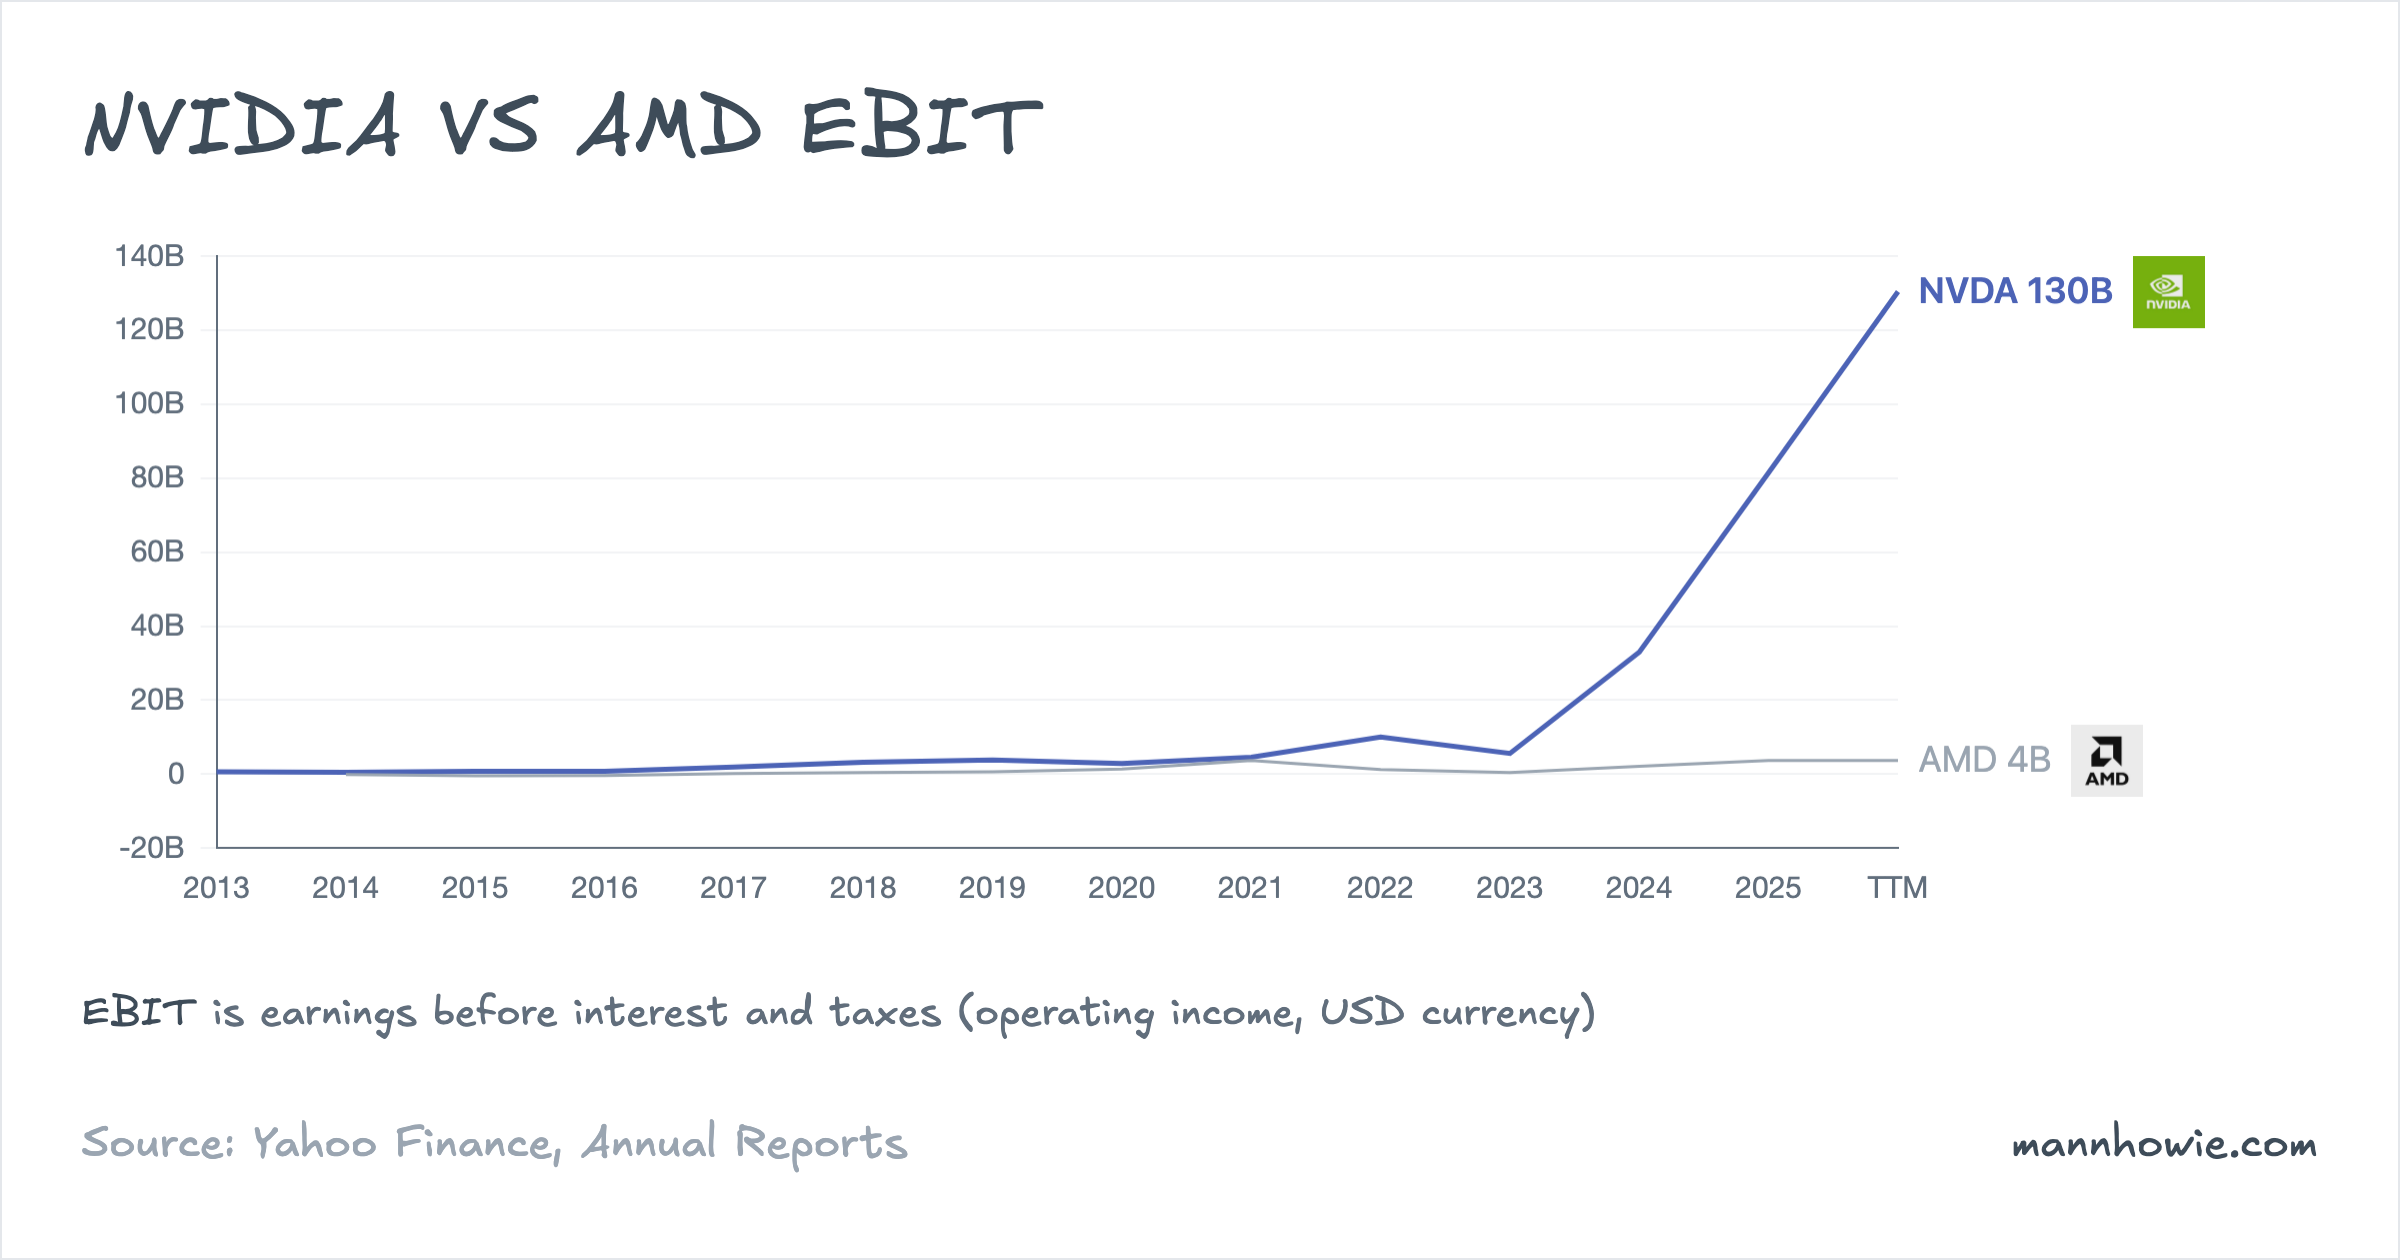
NVIDIA runs a 60% operating margin. AMD runs 10.7%. The gap is not scale — it is segment margin. NVIDIA’s Compute & Networking earns 67%. AMD’s Data Center earns 22%. A forty-five-point gap at the segment level is where the story sits.
At NVIDIA the mechanism is leverage. Gross margin reached 71% and operating expenses grew far slower than revenue, so incremental revenue dropped through at a high rate. Consolidated operating income reached $130.4B in FY2026, up from $5.6B in FY2023 — an increase of $124.8B.
At AMD the mechanism is mix plus amortisation. Semi-custom console SoCs earn thin margins by design; client CPUs price-compete against Intel. Layered on top is a $4.0B “All Other” reconciling line that strips out acquisition-intangibles amortisation ($2.3B in FY2025 from Xilinx, Pensando and ZT Systems) and stock-based compensation ($1.6B). Consolidated AMD operating income reached $3.7B in FY2025, up from $1.3B in FY2022 — an increase of $2.4B.
NVIDIA: operating income by reportable segment
NVIDIA reports segment operating income across two reportable segments. Compute & Networking covers Data Center compute, networking, Automotive and Jetson robotics. Graphics covers GeForce GPUs, vGPU software, Professional Visualization and Automotive infotainment. Unallocated items reconcile to consolidated operating income below the table.
| Segment (USD M) | FY2023 | FY2024 | FY2025 | FY2026 | % of FY26 | 3Y CAGR | 3Y Change ($) |
|---|---|---|---|---|---|---|---|
| Compute & Networking | 5,083 | 32,016 | 82,875 | 130,141 | 93.4% | 195% | +125,058 |
| Graphics | 4,552 | 5,846 | 5,085 | 9,156 | 6.6% | 26% | +4,604 |
| Total segment operating income | 9,635 | 37,862 | 87,960 | 139,297 | 100% | 144% | +129,662 |
| Less: reconciling items (SBC, unallocated opex, M&A) | (4,058) | (4,890) | (6,507) | (8,910) | — | — | — |
| Consolidated operating income | 5,577 | 32,972 | 81,453 | 130,387 | — | — | — |
Compute & Networking produced 93% of segment operating income in FY2026 and added $125B in three years — a forty-six-fold increase in dollar profit from a base of $5.1B.
The real commitment behind these numbers sits on the balance sheet, not the income statement. NVIDIA has $22.7B of future operating-lease obligations commencing FY2027 to FY2030, primarily for data-centre space, plus $3.5B of land, power and shell guarantees to AI infrastructure partners and $17.5B invested in private AI companies. These are multi-year pre-commitments the capex line does not capture.
“For the Data Centers, inference tokens per watt translates directly to the revenues of the CSPs … Compute equals revenues. Choosing the right architecture is incredibly important, is more than strategic now, it directly affects their earnings.”
— Jensen Huang, NVIDIA Q4 FY2026 earnings call
AMD: operating income by segment
AMD combined Client and Gaming into a single reportable segment in Q1 FY2025. The table uses the restated three-segment view; the FY2022 figure sums the original Client and Gaming disclosures to the same basis.
| Segment (USD M) | FY2022 | FY2023 | FY2024 | FY2025 | % of FY25 | 3Y CAGR | 3Y Change ($) |
|---|---|---|---|---|---|---|---|
| Data Center | 1,848 | 1,267 | 3,482 | 3,603 | 46.8% | 25% | +1,755 |
| Client and Gaming | 2,143 | 925 | 1,187 | 2,855 | 37.1% | 10% | +712 |
| Embedded | 2,252 | 2,628 | 1,421 | 1,243 | 16.1% | -17% | -1,009 |
| Total segment operating income | 6,243 | 4,820 | 6,090 | 7,701 | 100% | 7% | +1,458 |
| Less: All Other (amortisation, SBC, M&A, restructuring) | (4,979) | (4,419) | (4,190) | (4,007) | — | — | — |
| Consolidated operating income | 1,264 | 401 | 1,900 | 3,694 | — | 43% | +2,430 |
Data Center supplied 47% of segment operating income in FY2025 and added $1.8B. Client and Gaming combined added $0.7B. Embedded moved the other way, subtracting $1.0B and offsetting more than half of Data Center’s dollar gain at the segment level.
The 7% segment CAGR against 43% consolidated reflects the amortisation schedule running down. The All Other drag fell from $5.0B in FY2022 to $4.0B in FY2025 as Xilinx intangibles rolled off; stock-based compensation moved the other direction, from $1.1B to $1.6B. As acquisition intangibles continue to amortise, consolidated margin will converge closer to segment margin.
Capex
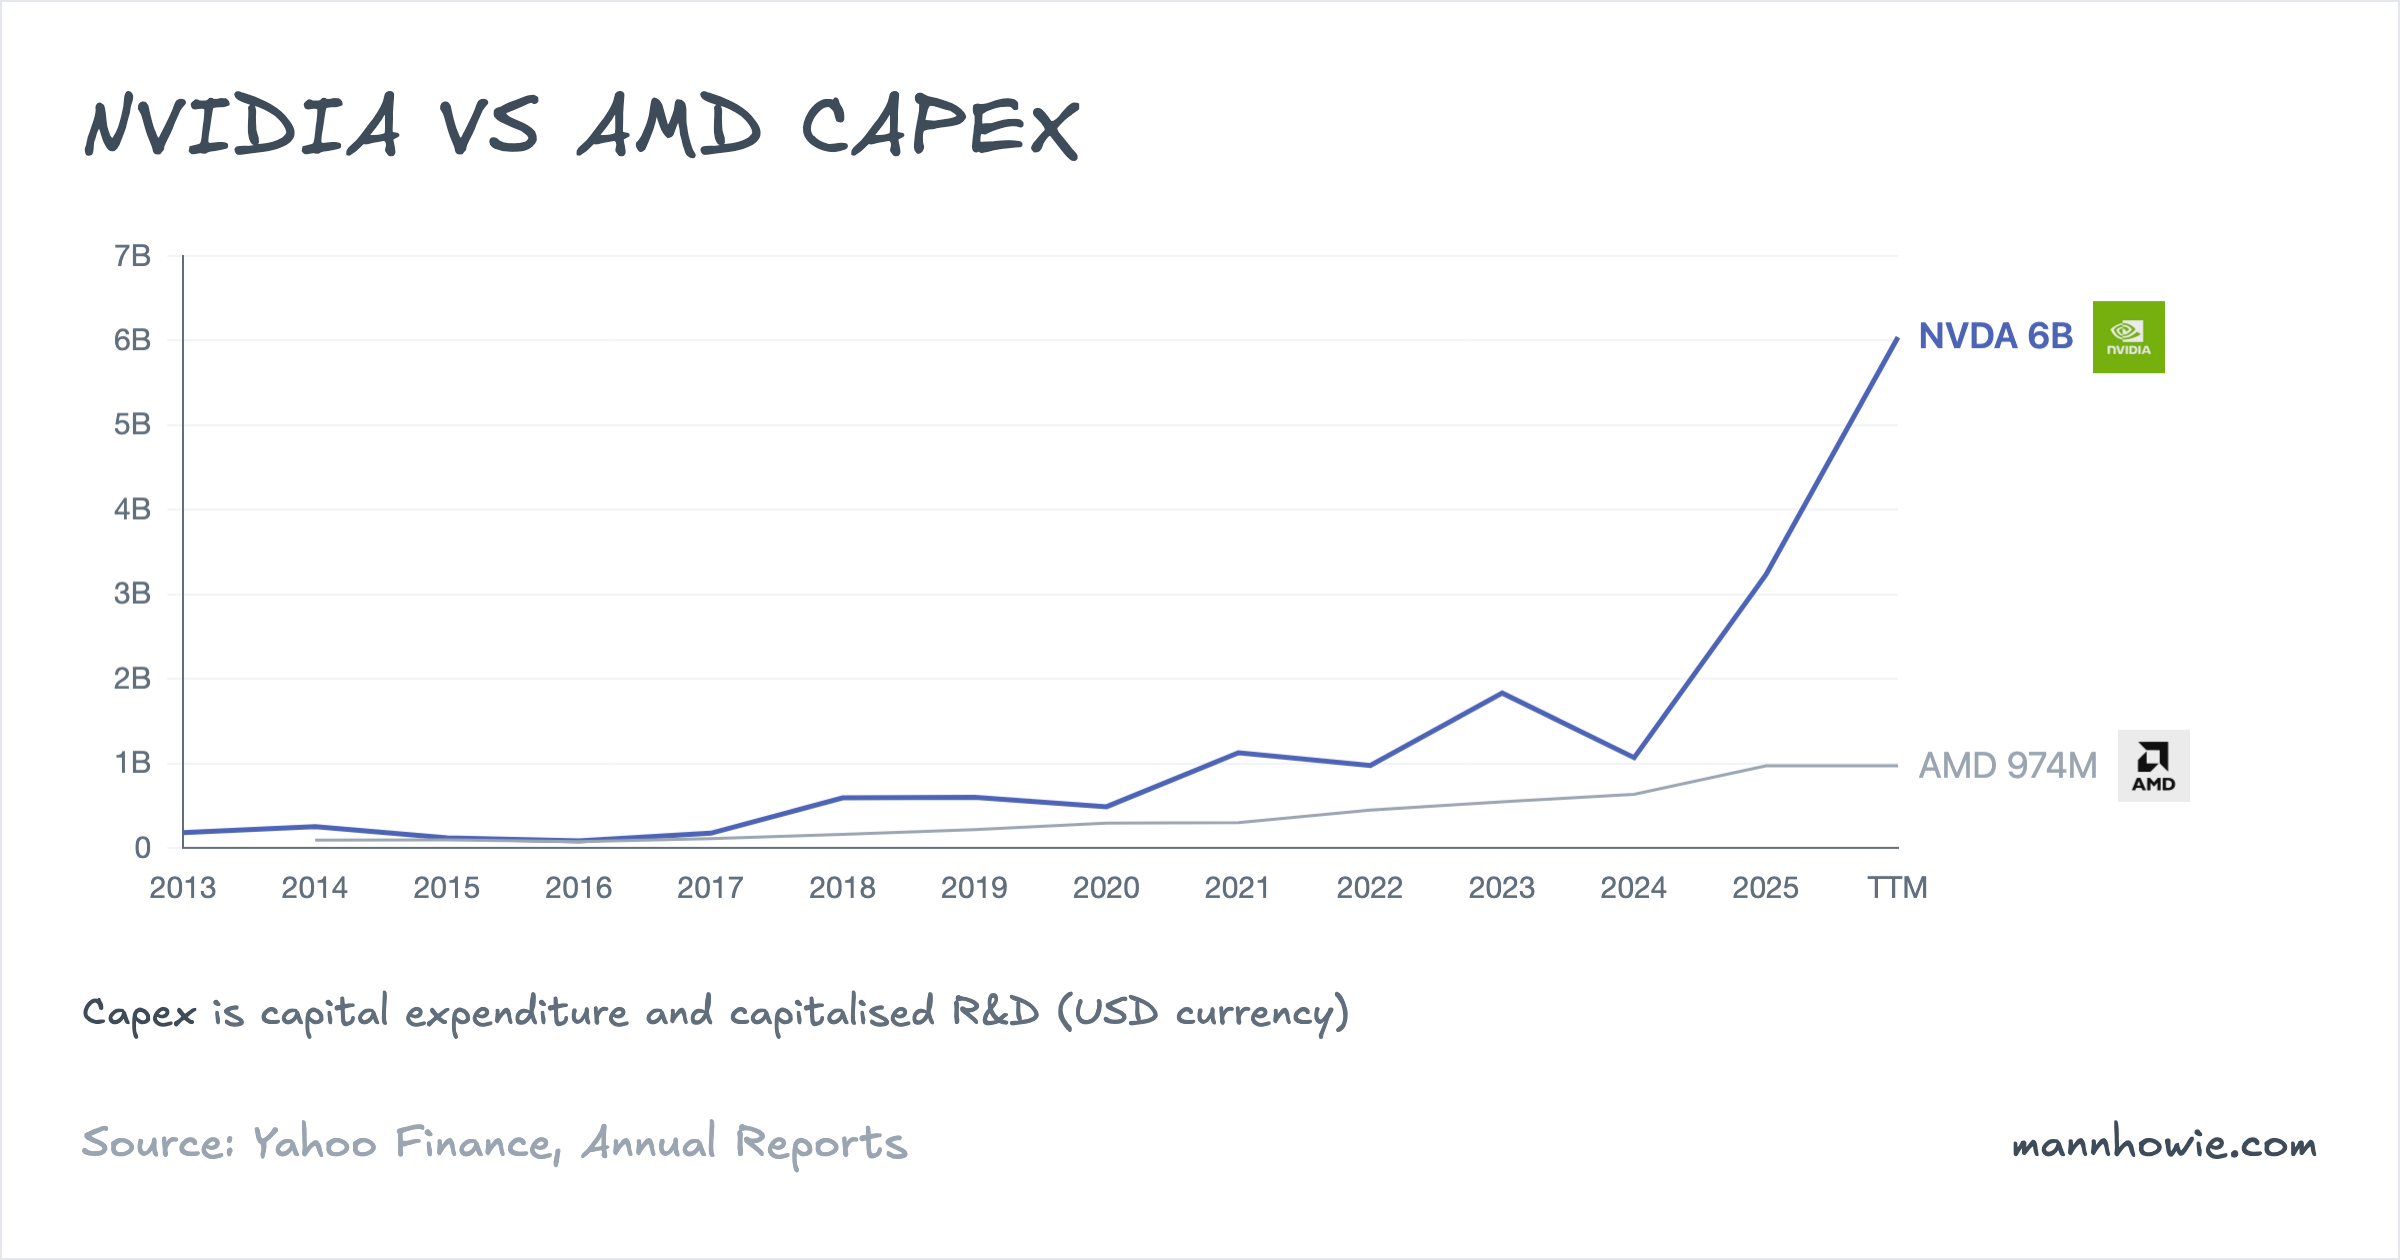
Both companies are fabless. Capex ran at 2.8% of revenue for each in their most recent fiscal years. The observable capex line understates NVIDIA’s real forward position: the $22.7B of data-centre lease commitments and $3.5B of land and power guarantees noted above represent a scale of multi-year pre-commitment that AMD, whose comparable obligations are limited to HBM and wafer supply agreements, does not match.
Sources
- Headline financials and chart data: finance.mannhowie.com/api/financials/NVDA and /AMD.
- NVIDIA 10-K FY2026 (year ended 25 January 2026), pages 40, 77 to 78.
- NVIDIA 10-K FY2024 (year ended 28 January 2024), pages 78 to 79.
- NVIDIA Q4 FY2026 earnings call, 25 February 2026.
- AMD 10-K FY2025 (year ended 27 December 2025), pages 47, 51, 70.
- AMD 10-K FY2023 (year ended 30 December 2023), pages 47, 66 to 67.
- AMD Q4 FY2025 earnings call and press release, February 2026.