Apple vs Microsoft: iPhone Concentration and Microsoft Cloud Growth
10 minute read | Apr 1, 2026 | Reviewed by Howie Mann
Apple sells consumer hardware and runs a large digital services business across its installed base. It earns money from iPhone, Mac, iPad, Apple Watch and AirPods sales, and from Services such as the App Store, advertising, AppleCare, iCloud, licensing and payment services.
Microsoft sells productivity software, cloud computing, developer tools, operating systems and gaming products to consumers and businesses. It earns money from Microsoft 365 subscriptions, Azure cloud usage, Windows and device licences, LinkedIn, Xbox and Activision gaming, and search advertising.
Revenue
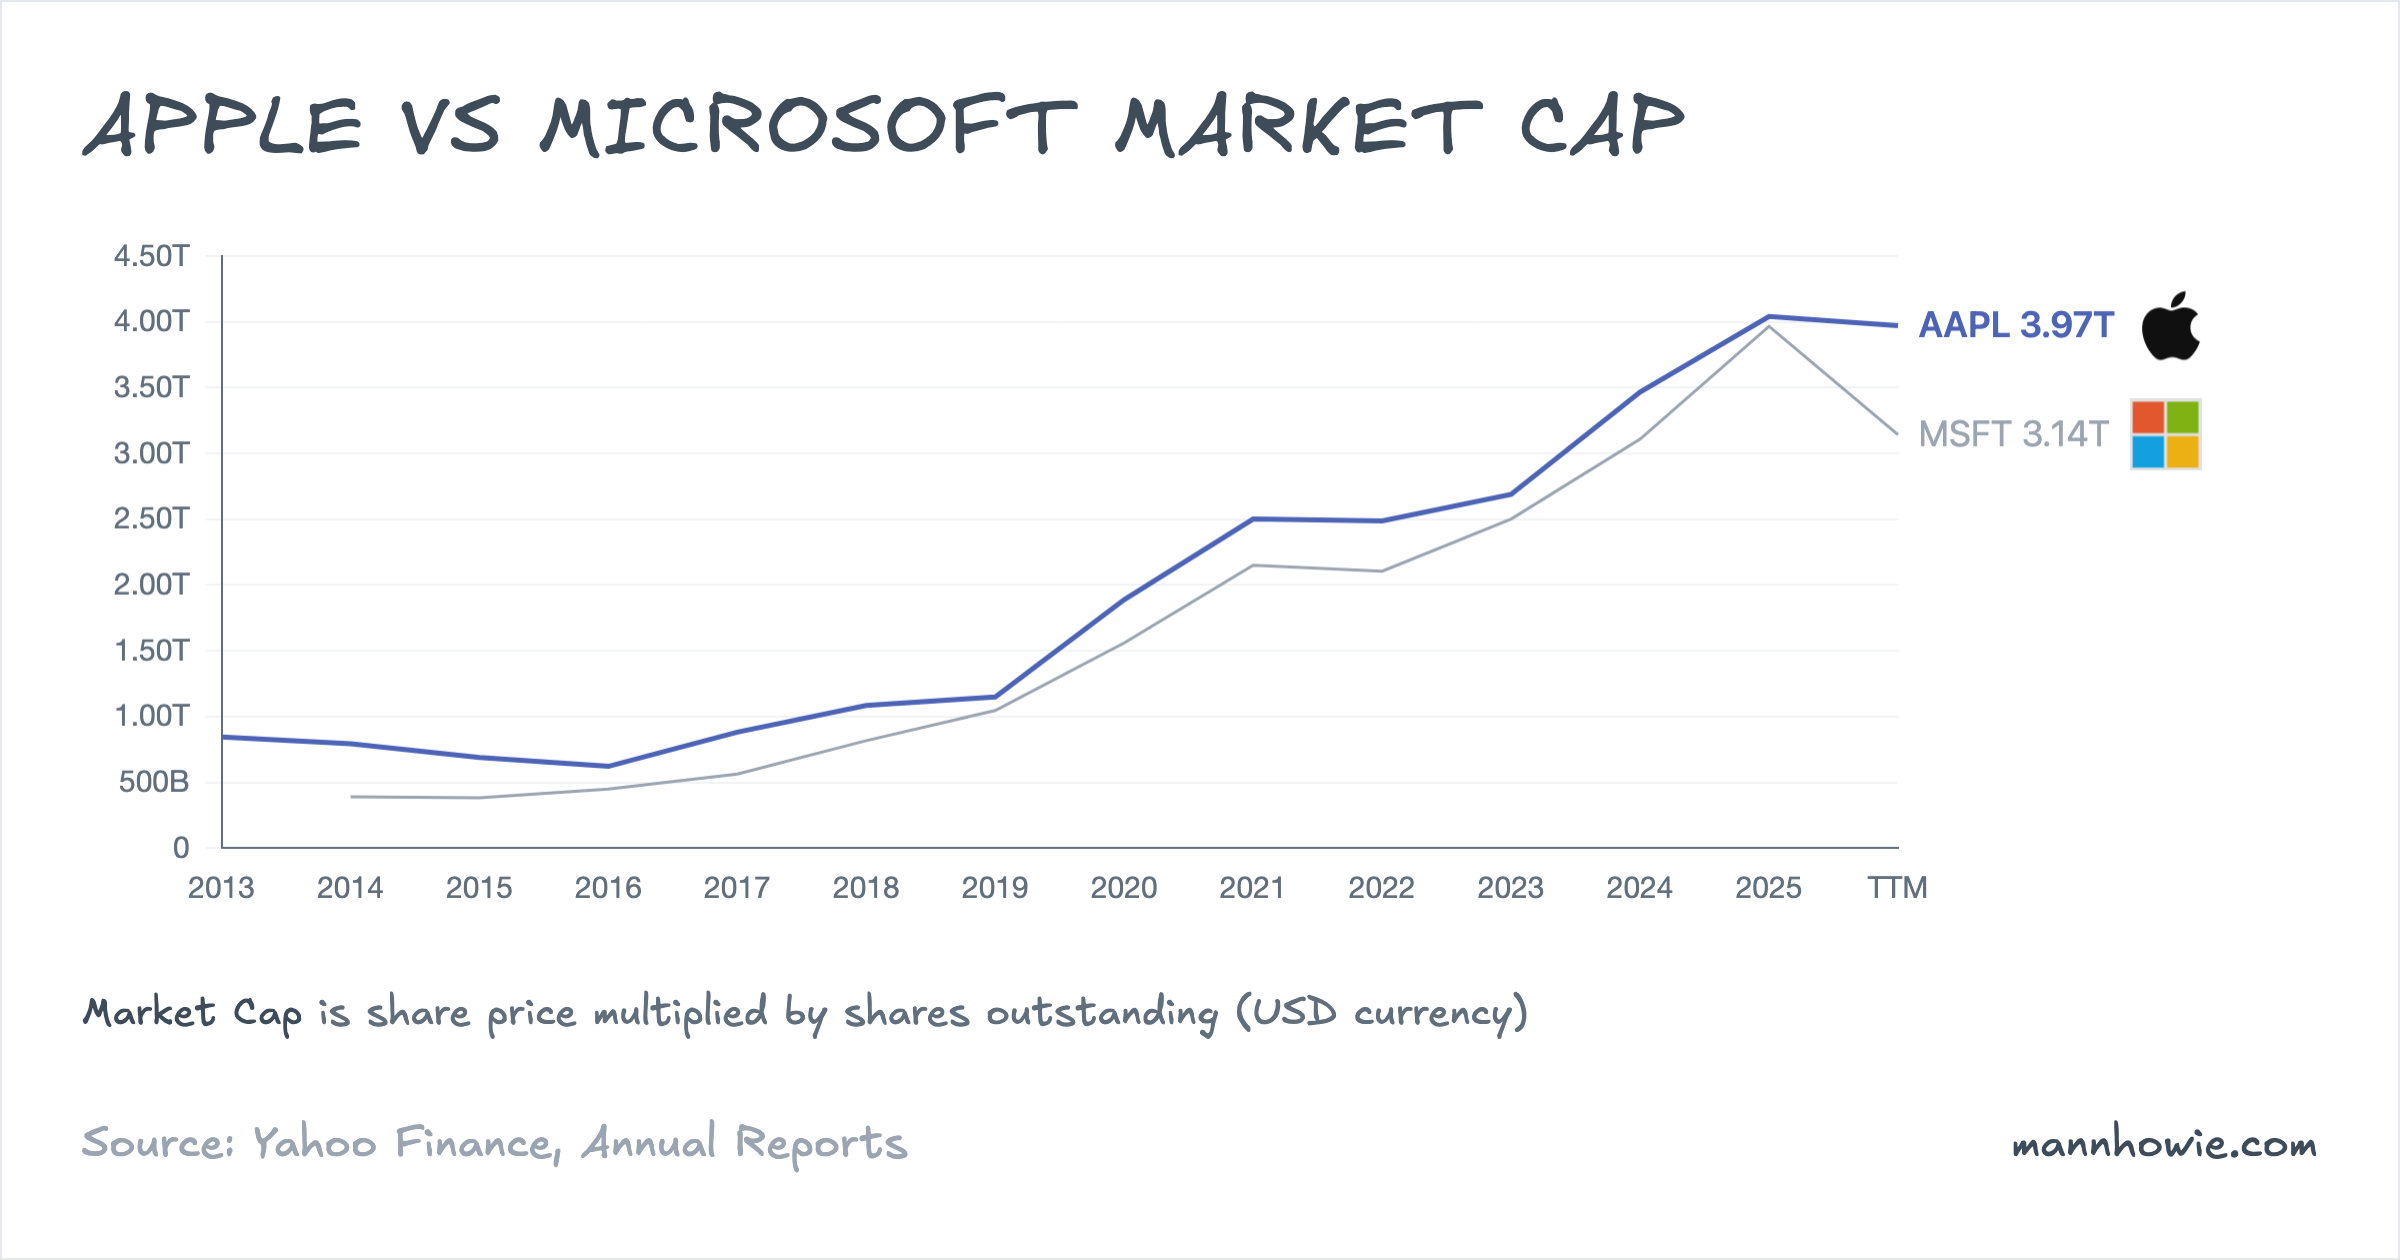
Apple’s trailing-twelve-month revenue of $435.6B is roughly 43% larger than Microsoft’s $305.5B, but the gap is narrowing. Between fiscal years 2022 and 2025, Apple grew revenue at a 1.8% compound annual rate and added about $22B of sales. Microsoft grew at 12.4% over the same window and added roughly $83B.
The mix behind each top line differs sharply. More than half of Apple’s revenue still comes from a single product line, iPhone, which grew 0.7% compound annual over three years. Microsoft’s revenue is dominated by subscription software and cloud services, where usage and pricing compound to produce double-digit growth.
Apple: revenue by product line
Apple reports net sales across five product and service categories.
| Line item (USD M) | FY2022 | FY2023 | FY2024 | FY2025 | % of FY25 | 3Y CAGR | 3Y Change ($) |
|---|---|---|---|---|---|---|---|
| iPhone | 205,489 | 200,583 | 201,183 | 209,586 | 50.4% | 0.7% | +4,097 |
| Services | 78,129 | 85,200 | 96,169 | 109,158 | 26.2% | 11.8% | +31,029 |
| Wearables, Home and Accessories | 41,241 | 39,845 | 37,005 | 35,686 | 8.6% | -4.7% | -5,555 |
| Mac | 40,177 | 29,357 | 29,984 | 33,708 | 8.1% | -5.7% | -6,469 |
| iPad | 29,292 | 28,300 | 26,694 | 28,023 | 6.7% | -1.5% | -1,269 |
| Total net sales | 394,328 | 383,285 | 391,035 | 416,161 | 100% | 1.8% | +21,833 |
iPhone remains the largest line at 50% of revenue. It grew at under 1% compound annual, broadly flat in dollar terms across the three-year window. Services was the largest absolute contributor, adding $31B, and is also the fastest-growing line at 12% compound annual. Wearables, Mac and iPad each declined in dollar terms over the same period.
Services revenue includes the App Store, advertising, AppleCare, iCloud, payment services, licensing and content subscriptions. Apple reports a Services gross margin of 75.4% for FY2025 against a Products gross margin of 36.8%. Every dollar of Services revenue therefore contributes roughly twice the gross profit of a dollar of hardware. That mix shift is the mechanism behind consolidated gross margin rising from 43.3% in FY2022 to 46.9% in FY2025.
Microsoft: revenue by segment
Microsoft reports three segments: Productivity and Business Processes, Intelligent Cloud, and More Personal Computing. Microsoft recast segment composition in August 2024, moving the commercial components of Microsoft 365 into Productivity and Business Processes. FY2022 figures under the prior structure ($63B PBP, $75B Intelligent Cloud, $60B More Personal Computing) are not directly comparable and are excluded.
| Segment (USD M) | FY2023 | FY2024 | FY2025 | % of FY25 | 2Y CAGR | 2Y Change ($) |
|---|---|---|---|---|---|---|
| Productivity and Business Processes | 94,151 | 106,820 | 120,810 | 42.9% | 13.3% | +26,659 |
| Intelligent Cloud | 72,944 | 87,464 | 106,265 | 37.7% | 20.6% | +33,321 |
| More Personal Computing | 44,820 | 50,838 | 54,649 | 19.4% | 10.4% | +9,829 |
| Total revenue | 211,915 | 245,122 | 281,724 | 100% | 15.3% | +69,809 |
Productivity and Business Processes is the largest segment at 43% of revenue. It houses Microsoft 365 Commercial and Consumer, LinkedIn, and Dynamics. Intelligent Cloud is the largest absolute driver and the fastest grower, adding roughly $33B over two years at a 21% compound annual rate. Server products and cloud services, the sub-line that contains Azure, reached $98.4B in FY2025, up from $65.0B in FY2023. Microsoft discloses that Azure and other cloud services revenue grew 34% in FY2025 and 30% in FY2024.
Microsoft Cloud revenue is the cleanest four-year series the company publishes. It spans all three segments and aggregates Azure, Microsoft 365 Commercial cloud, the commercial portion of LinkedIn, and Dynamics 365. It rose from $91.4B in FY2022 to $168.9B in FY2025, a 23% compound annual rate and an absolute increase of $77.5B. That increase is close to the entire three-year revenue gain at the group level.
EBIT and margins
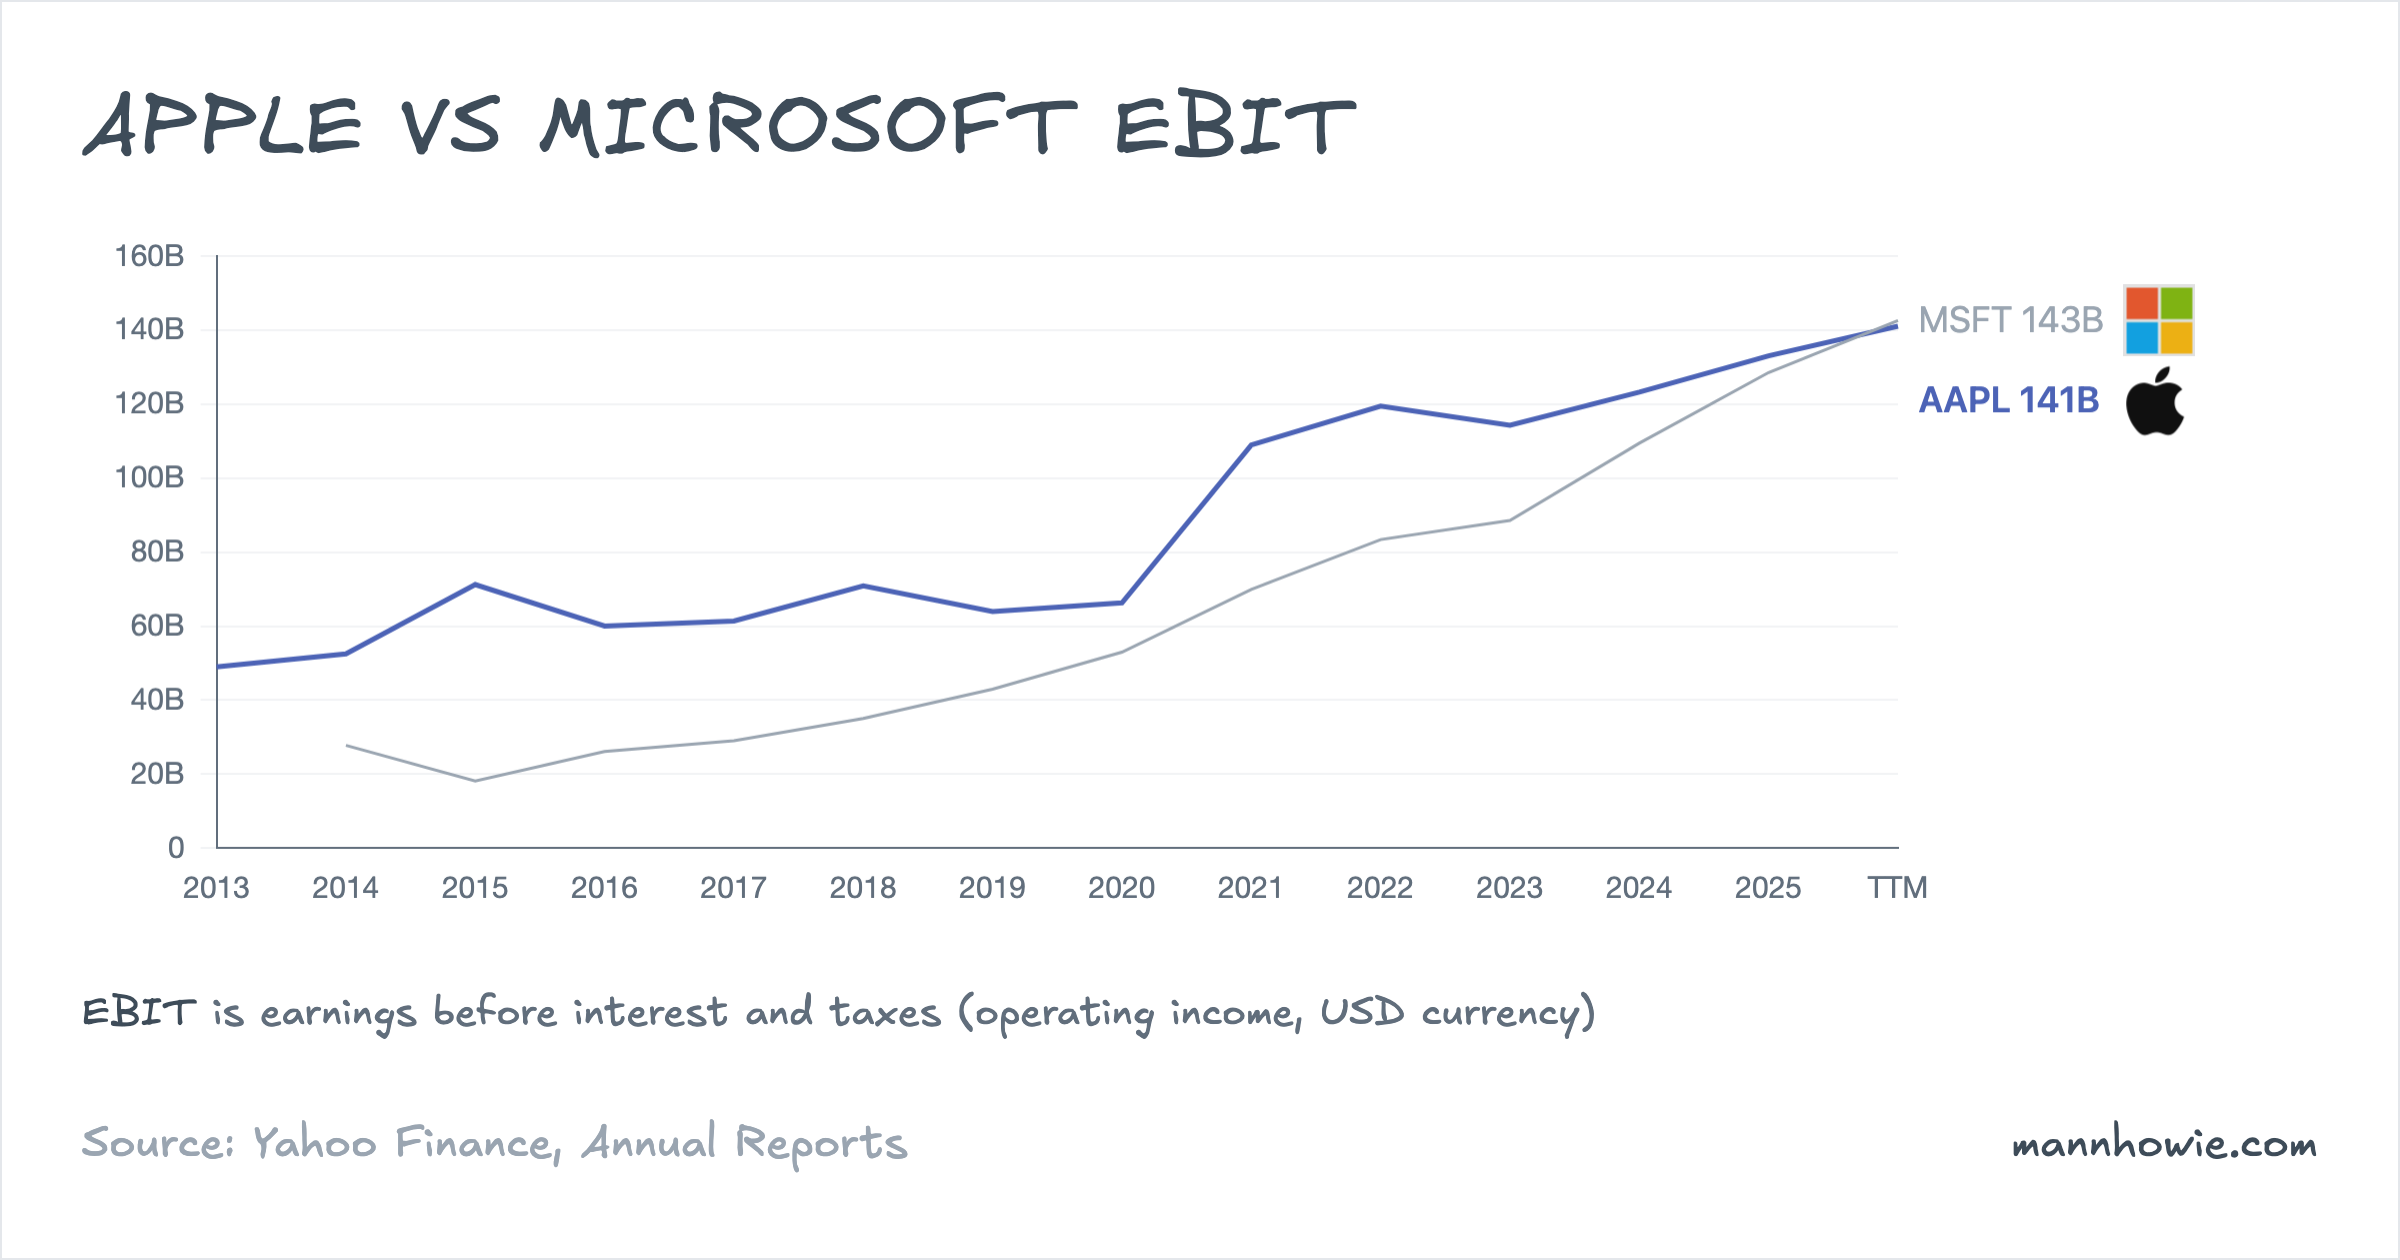
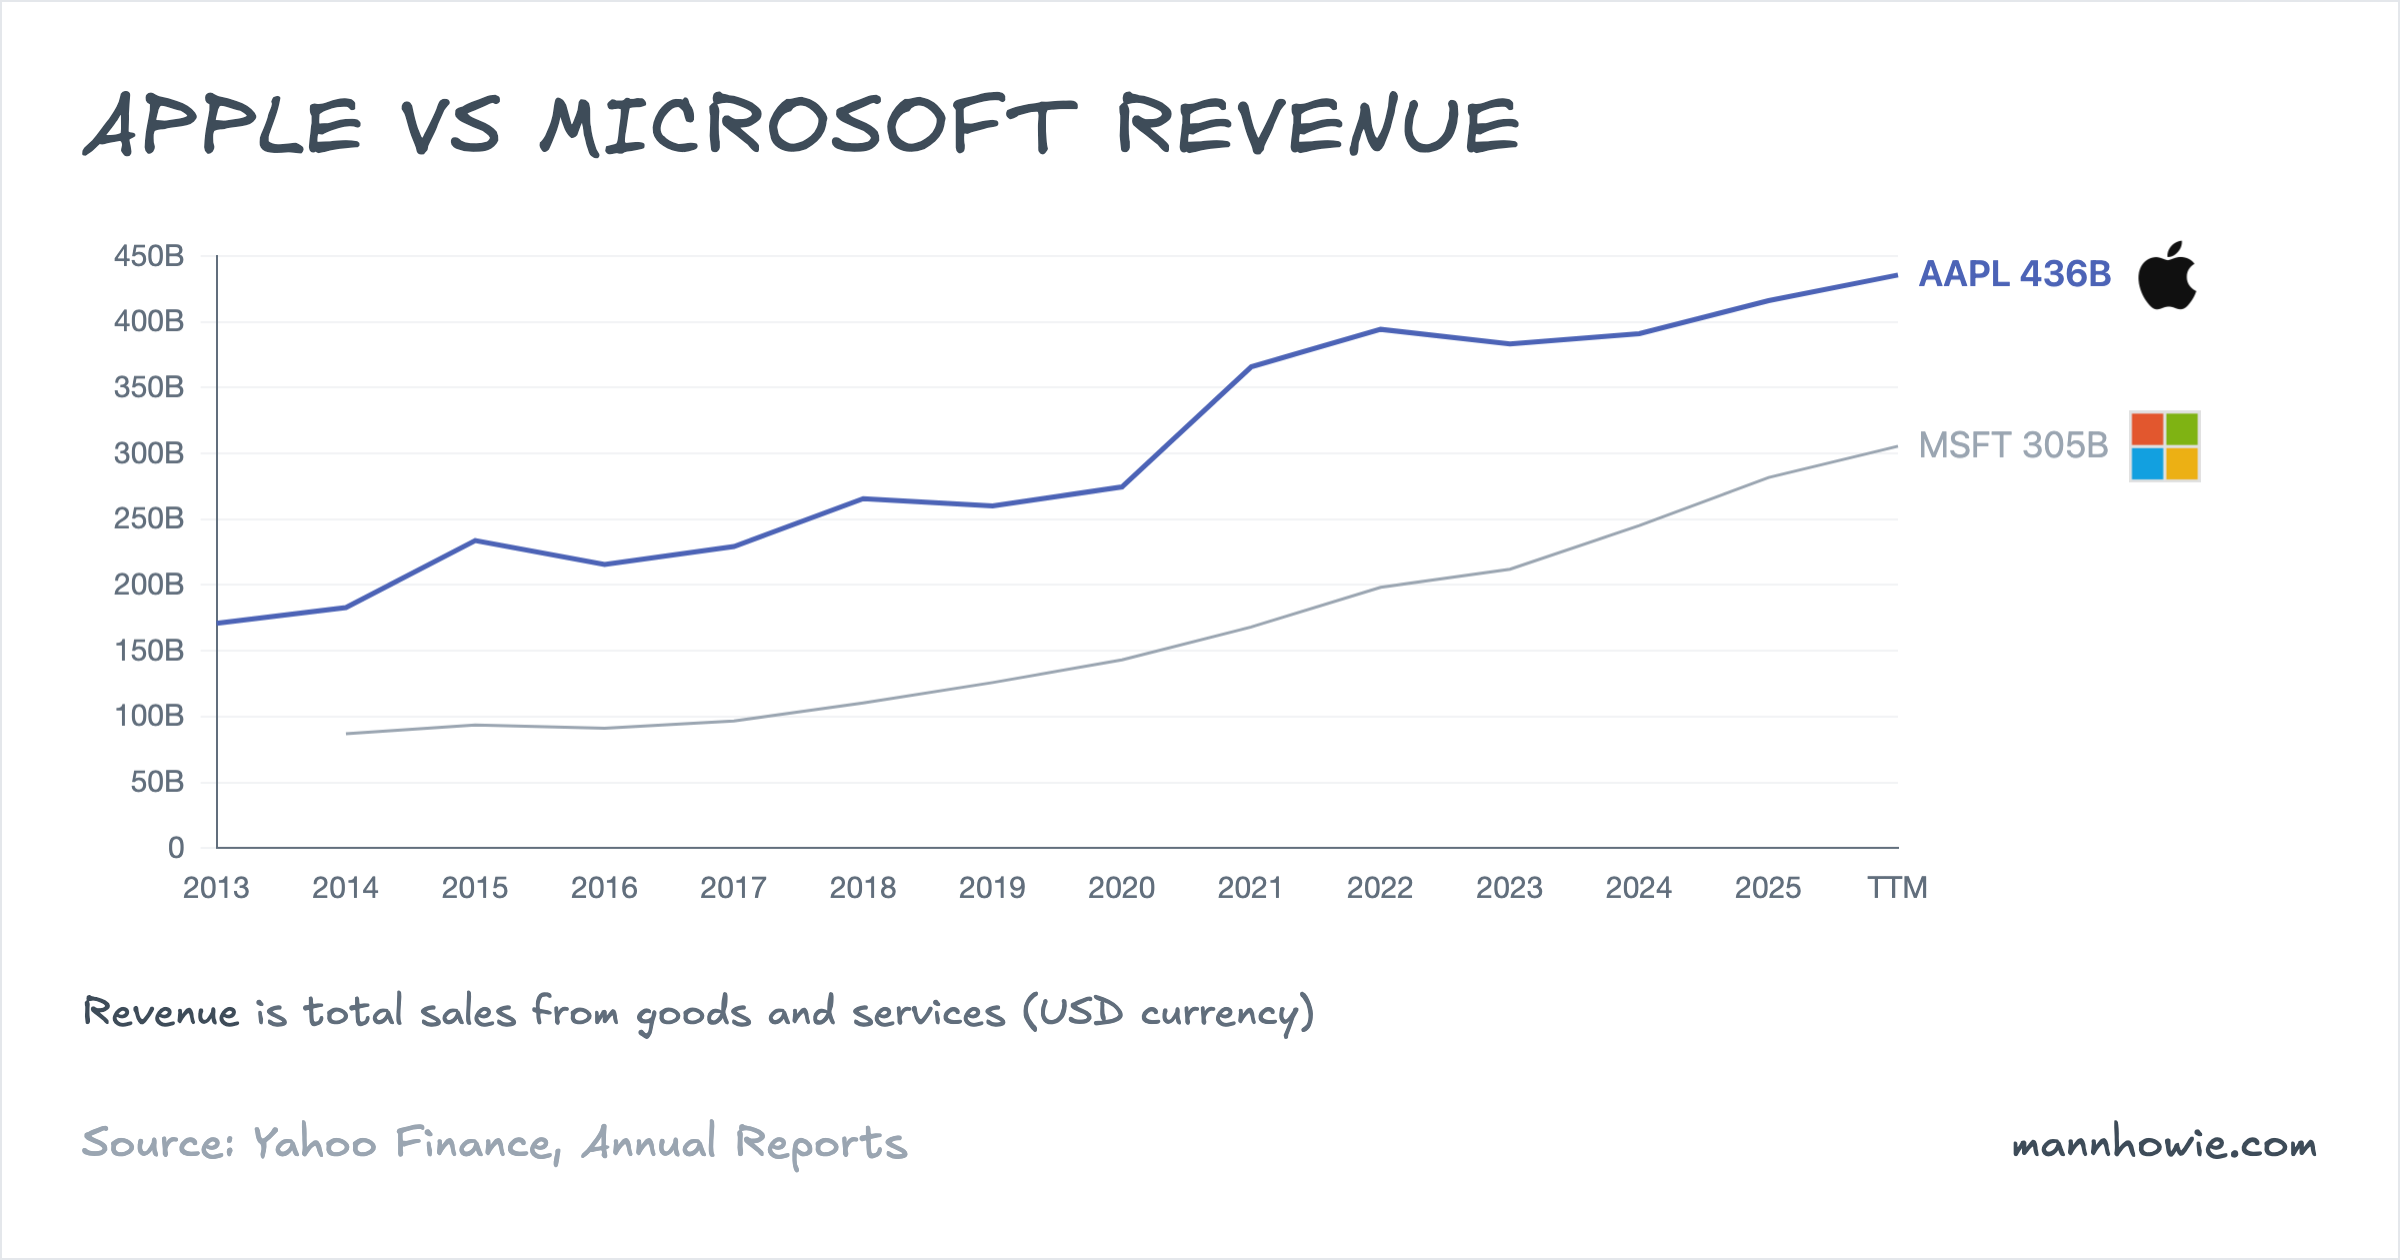
Trailing-twelve-month operating profit is within $2B at the two companies despite Apple’s larger revenue base.
| Metric (TTM) | Apple | Microsoft | Gap |
|---|---|---|---|
| Revenue | $435.6B | $305.5B | AAPL +43% |
| EBIT | $141.1B | $142.6B | MSFT +$1.5B |
| Operating margin | 32.4% | 46.7% | MSFT +14.3 pp |
| Gross margin | 47.3% | 68.6% | MSFT +21.3 pp |
| ROIC | 97.7% | 33.1% | AAPL +64.6 pp |
Microsoft converts roughly 47 cents of every revenue dollar into operating profit. Apple converts 32 cents. The gap is structural: Microsoft’s revenue is software and cloud, which carries lower cost of revenue than the bill of materials and assembly cost behind Apple hardware. The direction of travel also differs. Microsoft’s operating margin expanded from 42.1% in FY2022 to 45.6% in FY2025; Apple’s moved from 30.3% to 32.0% over the same window, driven almost entirely by the Services mix shift.
Apple’s ROIC of 98% reflects a small invested-capital base. The company carries roughly $120B of invested capital against $141B of TTM EBIT and returns cash aggressively: $91.8B of net share buybacks and $15.5B of dividends in the past twelve months. Microsoft’s ROIC of 33% sits against $348B of invested capital, a base that has grown rapidly as the company builds out AI infrastructure.
Apple: segment operating income
Apple reports operating income on a geographic basis, not by product line. The segment figures below sit above corporate costs such as centrally managed R&D and advertising, so the total exceeds consolidated EBIT.
| Segment (USD M) | FY2022 | FY2023 | FY2024 | FY2025 | % of FY25 | 3Y CAGR | 3Y Change ($) |
|---|---|---|---|---|---|---|---|
| Americas | 62,683 | 60,508 | 67,656 | 72,480 | 41.3% | 4.9% | +9,797 |
| Europe | 35,233 | 36,098 | 41,790 | 47,739 | 27.2% | 10.7% | +12,506 |
| Greater China | 31,153 | 30,328 | 27,082 | 26,917 | 15.3% | -4.7% | -4,236 |
| Japan | 12,257 | 11,888 | 12,454 | 13,955 | 7.9% | 4.4% | +1,698 |
| Rest of Asia Pacific | 11,569 | 12,066 | 13,062 | 14,586 | 8.3% | 8.0% | +3,017 |
| Segment total | 152,895 | 150,888 | 162,044 | 175,677 | 100% | 4.7% | +22,782 |
Europe added the most operating income in dollar terms ($12.5B) and grew at the highest rate (11% compound annual) of the five regions. Greater China is the only region in contraction, with operating income down $4.2B over three years; Apple cites local competition and macroeconomic conditions. The Americas, Apple’s largest region, grew 5% compound annual.
Microsoft: segment operating income
| Segment (USD M) | FY2023 | FY2024 | FY2025 | % of FY25 | 2Y CAGR | 2Y Change ($) |
|---|---|---|---|---|---|---|
| Productivity and Business Processes | 50,074 | 59,661 | 69,773 | 54.3% | 18.0% | +19,699 |
| Intelligent Cloud | 28,411 | 37,813 | 44,589 | 34.7% | 25.3% | +16,178 |
| More Personal Computing | 10,038 | 11,959 | 14,166 | 11.0% | 18.8% | +4,128 |
| Total | 88,523 | 109,433 | 128,528 | 100% | 20.5% | +40,005 |
Productivity and Business Processes produced $70B of operating income in FY2025 at a 58% operating margin, the highest of the three segments. Intelligent Cloud grew operating income fastest, at 25% compound annual. Microsoft reports that Intelligent Cloud gross margin percentage declined in FY2025 as the cost of scaling AI infrastructure outpaced revenue growth in Azure, offset in part by efficiency gains elsewhere in the segment.
Capital expenditure
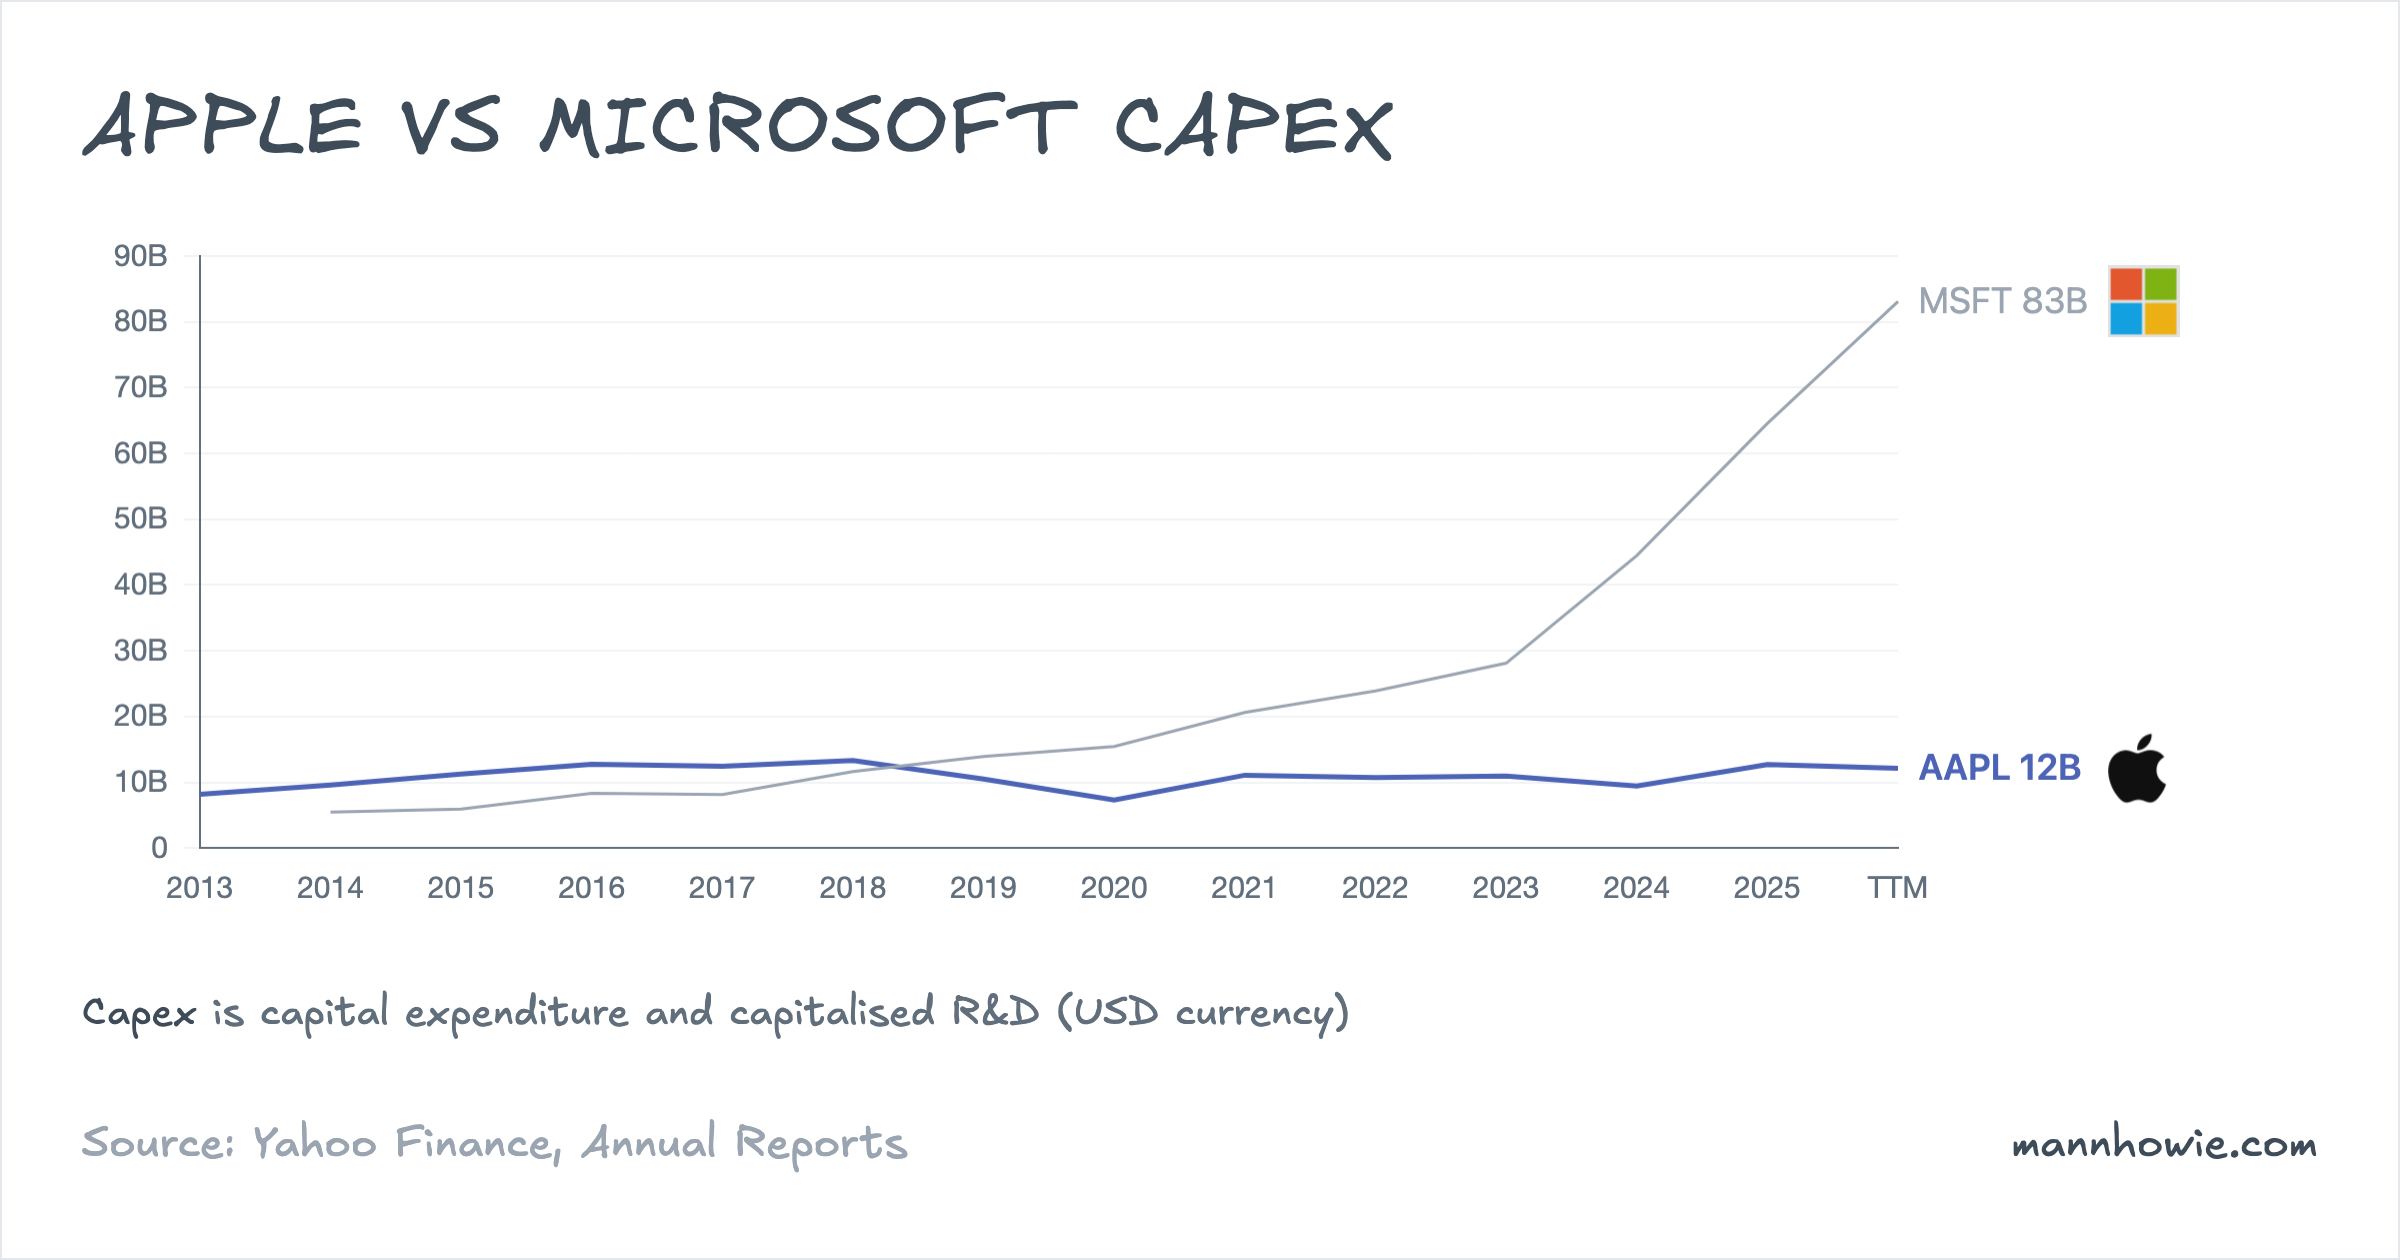
Capital intensity diverges sharply between the two.
| Capex (USD M) | FY2022 | FY2023 | FY2024 | FY2025 | TTM | 3Y Change (FY22→FY25) |
|---|---|---|---|---|---|---|
| Apple | 10,708 | 10,959 | 9,447 | 12,715 | 12,148 | +$2.0B |
| Microsoft | 23,886 | 28,107 | 44,477 | 64,551 | 83,094 | +$40.7B |
Apple’s capex has held broadly stable at $10–13B per year. The company outsources substantially all manufacturing and operates its own datacentres at a fraction of Microsoft’s footprint because its cloud workloads are narrower (iCloud, Siri, App Store, Apple Intelligence on-device inference with a private-cloud fallback). TTM capex of $12.1B sits at 3% of revenue.
Microsoft’s capex has nearly tripled over three fiscal years and is still accelerating. TTM additions to property and equipment reached $83.1B, or 27% of revenue, against $65.2B of TTM free cash flow. Microsoft ties the increase directly to AI infrastructure: graphics processors, datacentre shells, long-dated power contracts, and custom silicon (the Azure Maia and Cobalt chip families). The OpenAI partnership, under which the OpenAI API is exclusive to Azure and Microsoft holds rights to OpenAI’s models and infrastructure, has raised the capacity Microsoft needs to bring online.
“We opened new datacenters across six continents and now operate more than 400 datacenters in 70 regions, more than any other cloud provider. This year alone, we added over two gigawatts of new capacity. Every Azure region is now AI-first and can support liquid cooling, increasing the fungibility and the flexibility of our fleet.”
— Satya Nadella, Microsoft 2025 Annual Shareholder Letter
Depreciation follows with a lag. Microsoft’s trailing FCF conversion fell from 69% in FY2022 to 46% in FY2025 as the capex bill caught up with the cash flow statement. Apple’s FCF conversion is 78% on TTM figures; it returned $107.2B of cash to shareholders through buybacks and dividends in the last twelve months, roughly equal to its trailing free cash flow.
Sources
- Apple 10-K FY2024, pages 22–23 (net sales by category, segment net sales), page 47 (segment operating income, Note 13).
- Apple 10-K FY2025, pages 22–24 (MD&A: segment net sales, net sales by category, gross margin; Greater China commentary), page 47 (segment operating income, Note 13).
- Microsoft 10-K FY2024, pages 39, 44–45 (MD&A, Microsoft Cloud disclosures), pages 92–93 (segment revenue and operating income, Note 19, legacy structure).
- Microsoft 10-K FY2025, pages 35–40, 45 (MD&A: Microsoft Cloud, Azure growth, AI infrastructure investment, OpenAI partnership), pages 84–85 (segment revenue and operating income, Note 18, recast structure; Microsoft Cloud definition).
- Satya Nadella, Microsoft 2025 Annual Shareholder Letter, October 15, 2025 (AI infrastructure scale).