Microsoft vs Amazon: Software Margins, Cloud Competition and AI Capex
10 minute read | Apr 15, 2026 | Reviewed by Howie Mann
Microsoft sells productivity software, cloud computing, and consumer products including Windows, Xbox, and LinkedIn. It earns money from commercial cloud subscriptions, enterprise software licences, advertising, and gaming.
Amazon sells products online, runs a third-party marketplace, and rents cloud computing to businesses through AWS. It earns money from retail sales, seller and advertising fees, and AWS usage charges.
Revenue
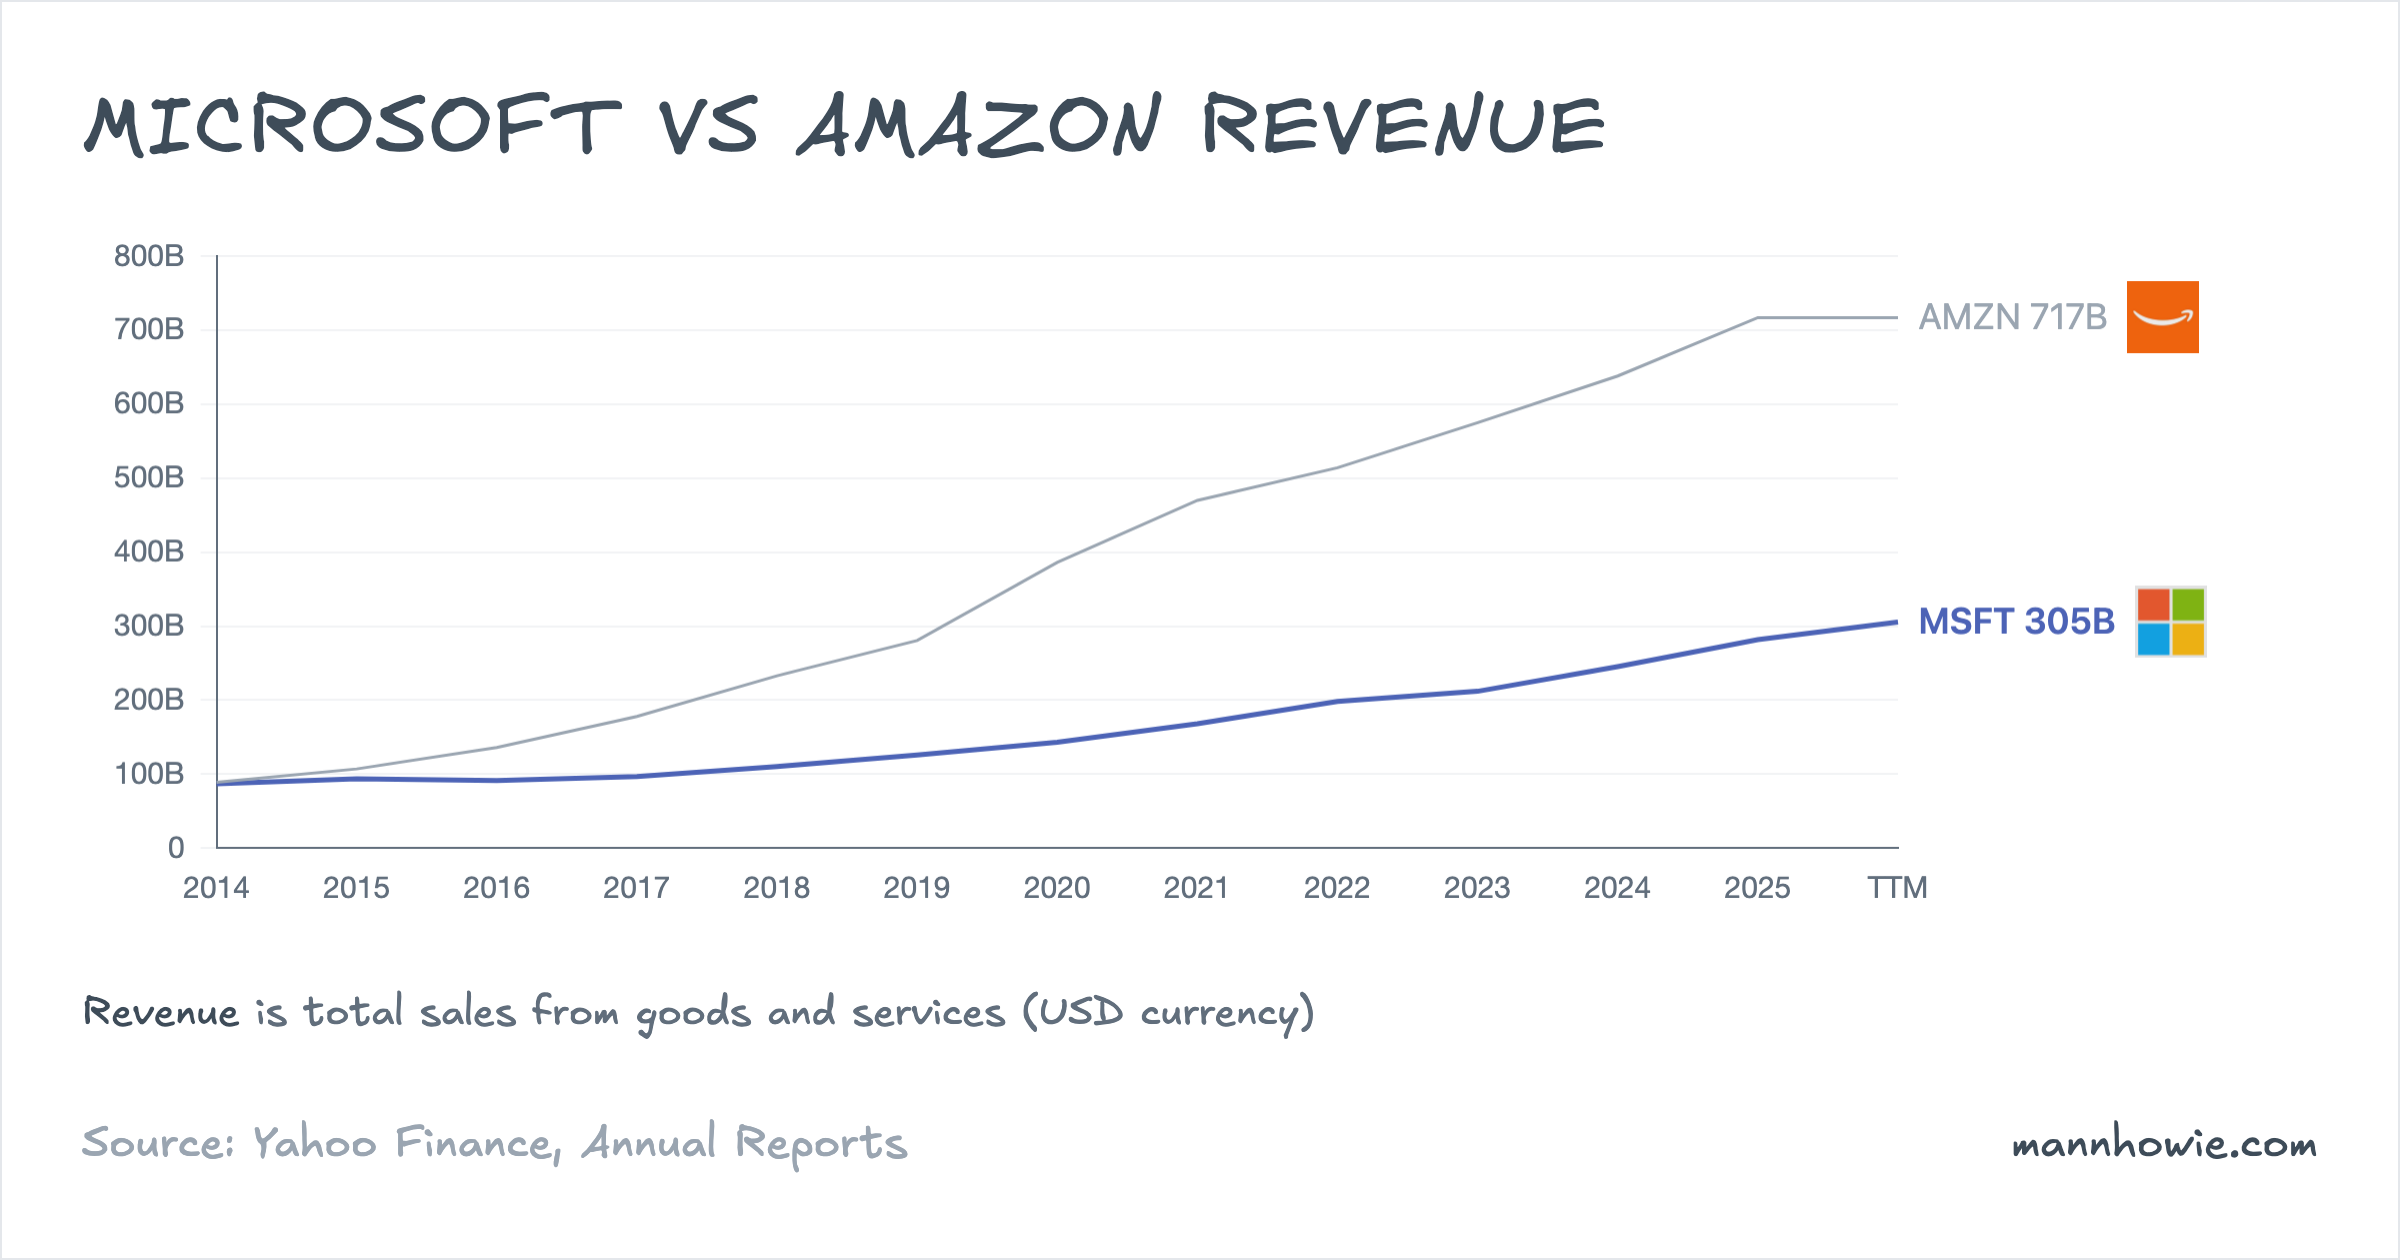
Amazon’s revenue is roughly 2.5 times Microsoft’s. Between FY2022 and FY2025, Amazon added $203B of sales at an 11.7% compound annual rate on a $514B base. Microsoft grew faster at 15.5% but added $83B on a $198B base, about two-fifths of Amazon’s absolute increase.
The gap is structural. Online stores, Amazon’s largest line, books the full transaction value as revenue. Third-party seller services books only commissions and fulfilment fees, but together these two retail lines account for 62% of Amazon’s top line. Microsoft’s revenue is largely software subscriptions and cloud services, which convert to operating profit at roughly four times Amazon’s rate.
Microsoft: revenue by product and service
Microsoft restated its product-line categories in FY2025; the table uses the new basis.
| Product / service (USD M) | FY2023 | FY2024 | FY2025 | % of FY25 | 2Y CAGR | 2Y Change ($) |
|---|---|---|---|---|---|---|
| Server products and cloud services | 65,007 | 79,828 | 98,435 | 34.9% | 23.0% | +33,428 |
| Microsoft 365 Commercial | 66,949 | 76,969 | 87,767 | 31.2% | 14.5% | +20,818 |
| Gaming | 15,466 | 21,503 | 23,455 | 8.3% | 23.1% | +7,989 |
| 14,989 | 16,372 | 17,812 | 6.3% | 9.0% | +2,823 | |
| Windows and Devices | 17,147 | 17,026 | 17,314 | 6.1% | 0.5% | +167 |
| Search and news advertising | 12,125 | 12,306 | 13,878 | 4.9% | 7.0% | +1,753 |
| Dynamics | 5,796 | 6,831 | 7,827 | 2.8% | 16.2% | +2,031 |
| Enterprise and partner services | 7,900 | 7,594 | 7,760 | 2.8% | -0.9% | -140 |
| Microsoft 365 Consumer | 6,417 | 6,648 | 7,404 | 2.6% | 7.4% | +987 |
| Other | 119 | 45 | 72 | 0.0% | n/m | -47 |
| Consolidated | 211,915 | 245,122 | 281,724 | 100% | 15.3% | +69,809 |
Server products and cloud services, which includes Azure, is the largest line and added the most revenue: $33B over two years at a 23% compound annual rate. Azure itself surpassed $75B in FY2025 revenue and grew 34% year-over-year. Microsoft 365 Commercial is the second-largest line and added $21B. Together these two lines account for 66% of revenue and drove $54B of the $70B total increase.
The $69B Activision Blizzard acquisition closed in October 2023 and lifted Gaming from $15.5B to $21.5B; organic growth was modest. Windows and Devices was flat at $17B.
Microsoft separately discloses “Microsoft Cloud” revenue, a non-segment metric spanning Azure, M365 Commercial cloud, commercial LinkedIn, and Dynamics 365. It reached $168.9B in FY2025, up from $111.6B in FY2023, a 23% compound annual rate.
Amazon: revenue by product line
| Line item (USD M) | FY2022 | FY2023 | FY2024 | FY2025 | % of FY25 | 3Y CAGR | 3Y Change ($) |
|---|---|---|---|---|---|---|---|
| Online stores | 220,004 | 231,872 | 247,029 | 269,287 | 37.6% | 7.0% | +49,283 |
| Third-party seller services | 117,716 | 140,053 | 156,146 | 172,162 | 24.0% | 13.5% | +54,446 |
| AWS | 80,096 | 90,757 | 107,556 | 128,725 | 18.0% | 17.1% | +48,629 |
| Advertising services | 37,739 | 46,906 | 56,214 | 68,635 | 9.6% | 22.0% | +30,896 |
| Subscription services | 35,218 | 40,209 | 44,374 | 49,619 | 6.9% | 12.1% | +14,401 |
| Physical stores | 18,963 | 20,030 | 21,215 | 22,561 | 3.1% | 6.0% | +3,598 |
| Other | 4,247 | 4,958 | 5,425 | 5,935 | 0.8% | 11.8% | +1,688 |
| Consolidated | 513,983 | 574,785 | 637,959 | 716,924 | 100% | 11.7% | +202,941 |
Retail lines dominate Amazon’s top line. Online stores and Third-party seller services together account for 62% of revenue. Third-party seller services added the most absolute revenue at $54B over three years, followed by Online stores and AWS at roughly $49B each. Advertising services posted the highest growth rate at 22% CAGR on a $38B base, adding $31B.
AWS competes directly with Microsoft’s Azure. At $128.7B in FY2025, AWS is roughly 70% larger than Azure’s $75B, though Azure is growing faster: 34% versus 20% year-over-year. AWS and Advertising together moved from a combined $118B in 2022 to $197B in 2025, and together account for the bulk of Amazon’s operating profit.
EBIT and margins
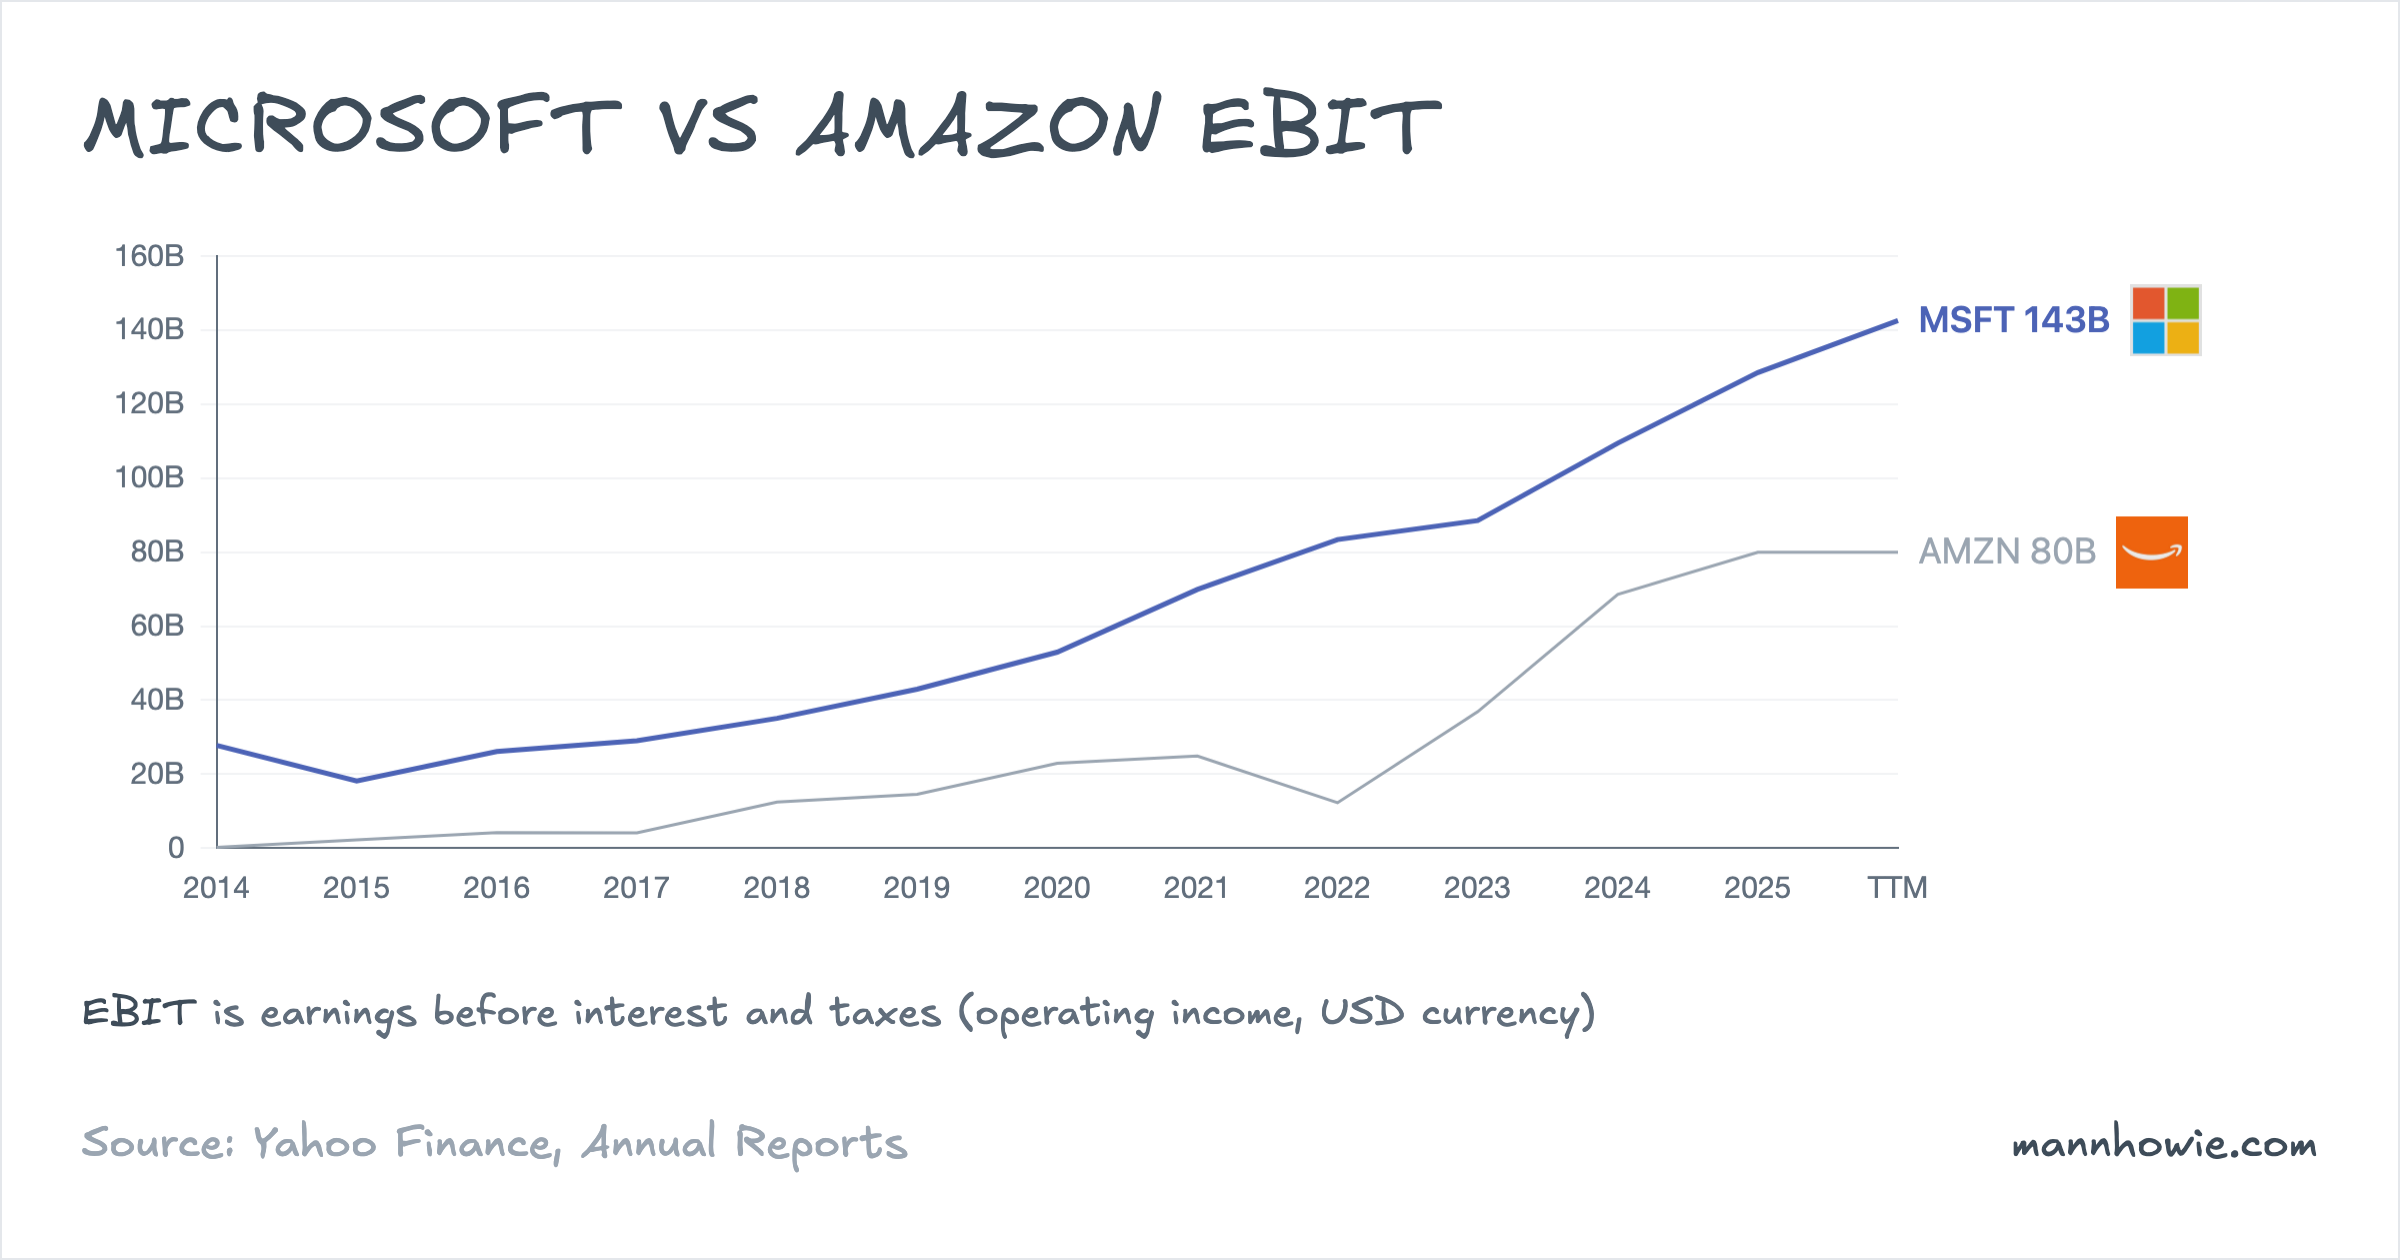
Amazon generates more than twice the revenue. Microsoft earns nearly twice the operating profit.
| Metric (TTM) | Microsoft | Amazon | Gap |
|---|---|---|---|
| Revenue | $305.5B | $716.9B | AMZN +135% |
| EBIT | $142.6B | $80.0B | MSFT +$63B |
| Operating margin | 46.7% | 11.2% | MSFT +35.5 pp |
| ROIC | 33.1% | 16.5% | MSFT +16.6 pp |
| Gross margin | 68.6% | 50.3% | MSFT +18.3 pp |
Microsoft converts nearly 47 cents of every revenue dollar into operating profit. Amazon converts about 11 cents. The gap starts at the gross margin level. Microsoft’s 69% gross margin reflects software economics where incremental copies carry near-zero marginal cost. Amazon’s 50% reflects the physical cost of moving goods through a fulfilment network and running last-mile delivery.
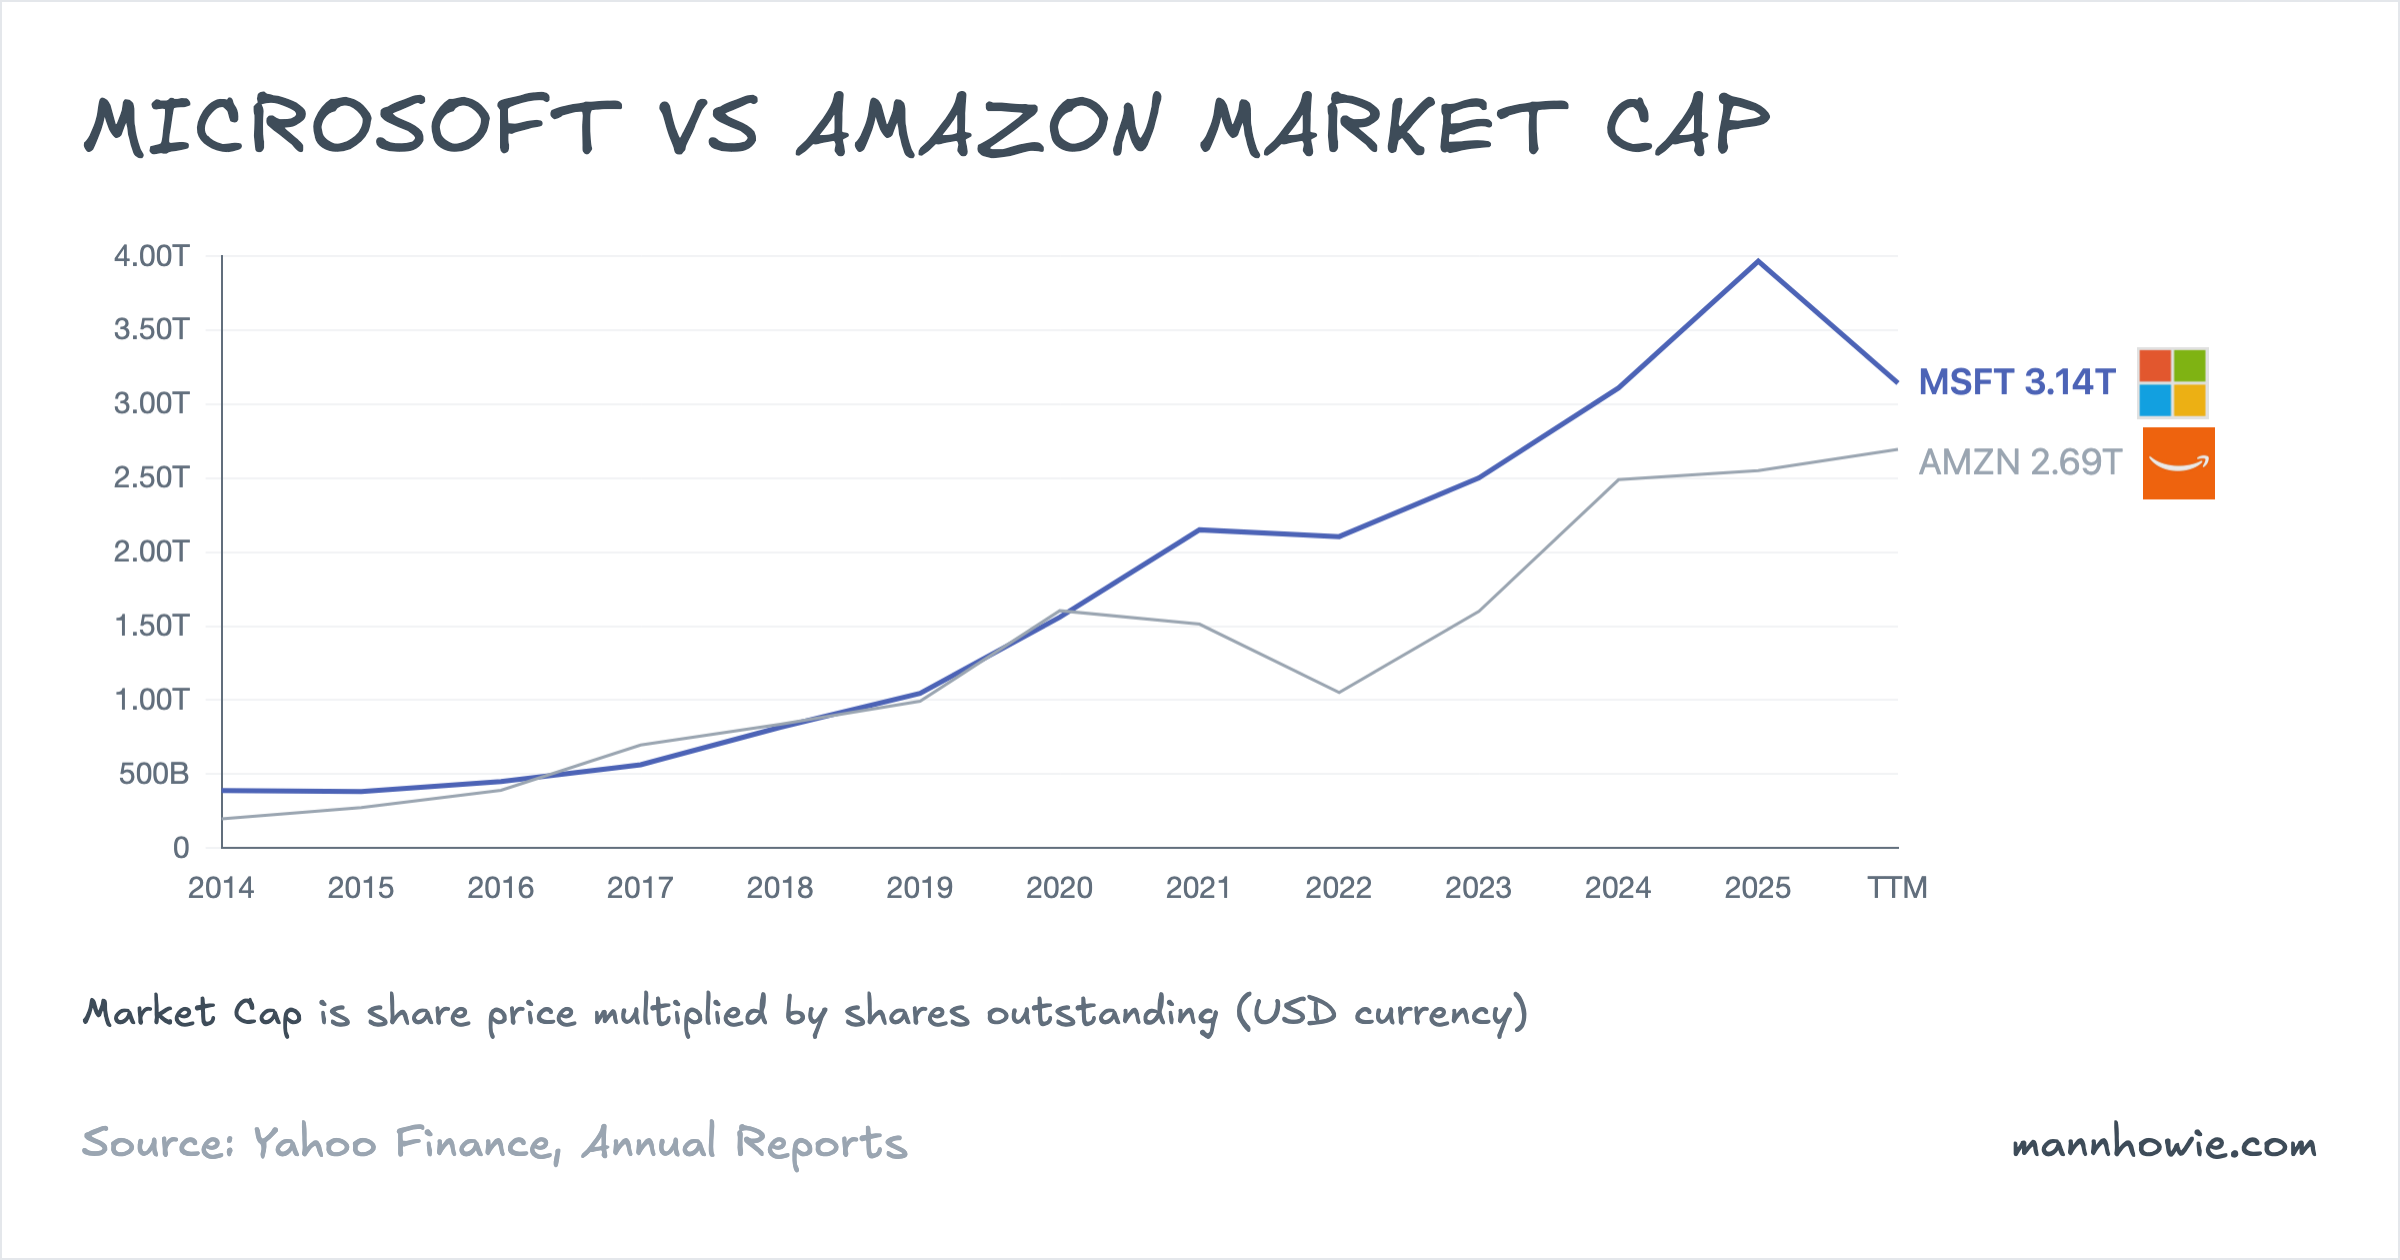
Equity markets value Microsoft at $3.14T and Amazon at $2.69T. Microsoft trades at a P/E of 26x versus Amazon’s 35x, and an EV/EBIT of 22x versus 33x.
Microsoft: segment EBIT
Microsoft reports three segments, restated in FY2025.
| Segment (USD M) | FY2023 | FY2024 | FY2025 | % of FY25 EBIT | 2Y CAGR | 2Y Change ($) |
|---|---|---|---|---|---|---|
| Productivity and Business Processes | 50,074 | 59,661 | 69,773 | 54.3% | 18.1% | +19,699 |
| Intelligent Cloud | 28,411 | 37,813 | 44,589 | 34.7% | 25.3% | +16,178 |
| More Personal Computing | 10,038 | 11,959 | 14,166 | 11.0% | 18.8% | +4,128 |
| Consolidated | 88,523 | 109,433 | 128,528 | 100% | 20.5% | +40,005 |
Productivity and Business Processes generates 54% of operating profit at a 57.8% margin on $121B of revenue. It houses the commercial Microsoft 365 suite, Dynamics, and LinkedIn, all recurring subscription businesses with high incremental margins. Intelligent Cloud is the fastest grower at 25.3% compound annual, adding $16B over two years. Its 42.0% operating margin reflects a mix of high-margin on-premises licences (Windows Server, SQL Server) and lower-margin cloud infrastructure (Azure).
Microsoft Cloud gross margin declined from roughly 71% in FY2024 to 69% in FY2025. The 10-K attributes this to the cost of scaling AI infrastructure, partially offset by efficiency gains in Azure. The same filing notes that cloud and AI infrastructure investment will continue to raise operating costs, a reversal from the margin expansion of Azure’s earlier growth phase.
Amazon: segment EBIT
| Segment (USD M) | FY2022 | FY2023 | FY2024 | FY2025 | % of FY25 EBIT | 3Y CAGR | 3Y Change ($) |
|---|---|---|---|---|---|---|---|
| AWS | 22,841 | 24,631 | 39,834 | 45,606 | 57.0% | 25.9% | +22,765 |
| North America | (2,847) | 14,877 | 24,967 | 29,619 | 37.0% | n/m | +32,466 |
| International | (7,746) | (2,656) | 3,792 | 4,750 | 5.9% | n/m | +12,496 |
| Consolidated | 12,248 | 36,852 | 68,593 | 79,975 | 100% | 86.9% | +67,727 |
AWS generates 18% of Amazon’s revenue but 57% of its operating profit, at a 35.4% segment margin on $128.7B of sales. North America retail added the most absolute profit over three years: a $32B swing from a $2.8B operating loss in 2022 to a $29.6B profit in 2025. Management attributed the turnaround to a regionalised fulfilment network, tighter headcount growth, and higher throughput per facility. The International segment followed at smaller scale, turning profitable in 2024.
The 87% consolidated EBIT CAGR from 2022 should be read against the base. The 2022 figure of $12B included a Rivian investment writedown and an overbuilt cost structure from pandemic-era expansion. From 2023 to 2025, consolidated EBIT roughly doubled.
AWS’s 35.4% margin compares with Microsoft Intelligent Cloud’s 42.0%, though the comparison is imperfect. Intelligent Cloud bundles high-margin on-premises licences alongside Azure infrastructure, while AWS is pure cloud.
Capital expenditure
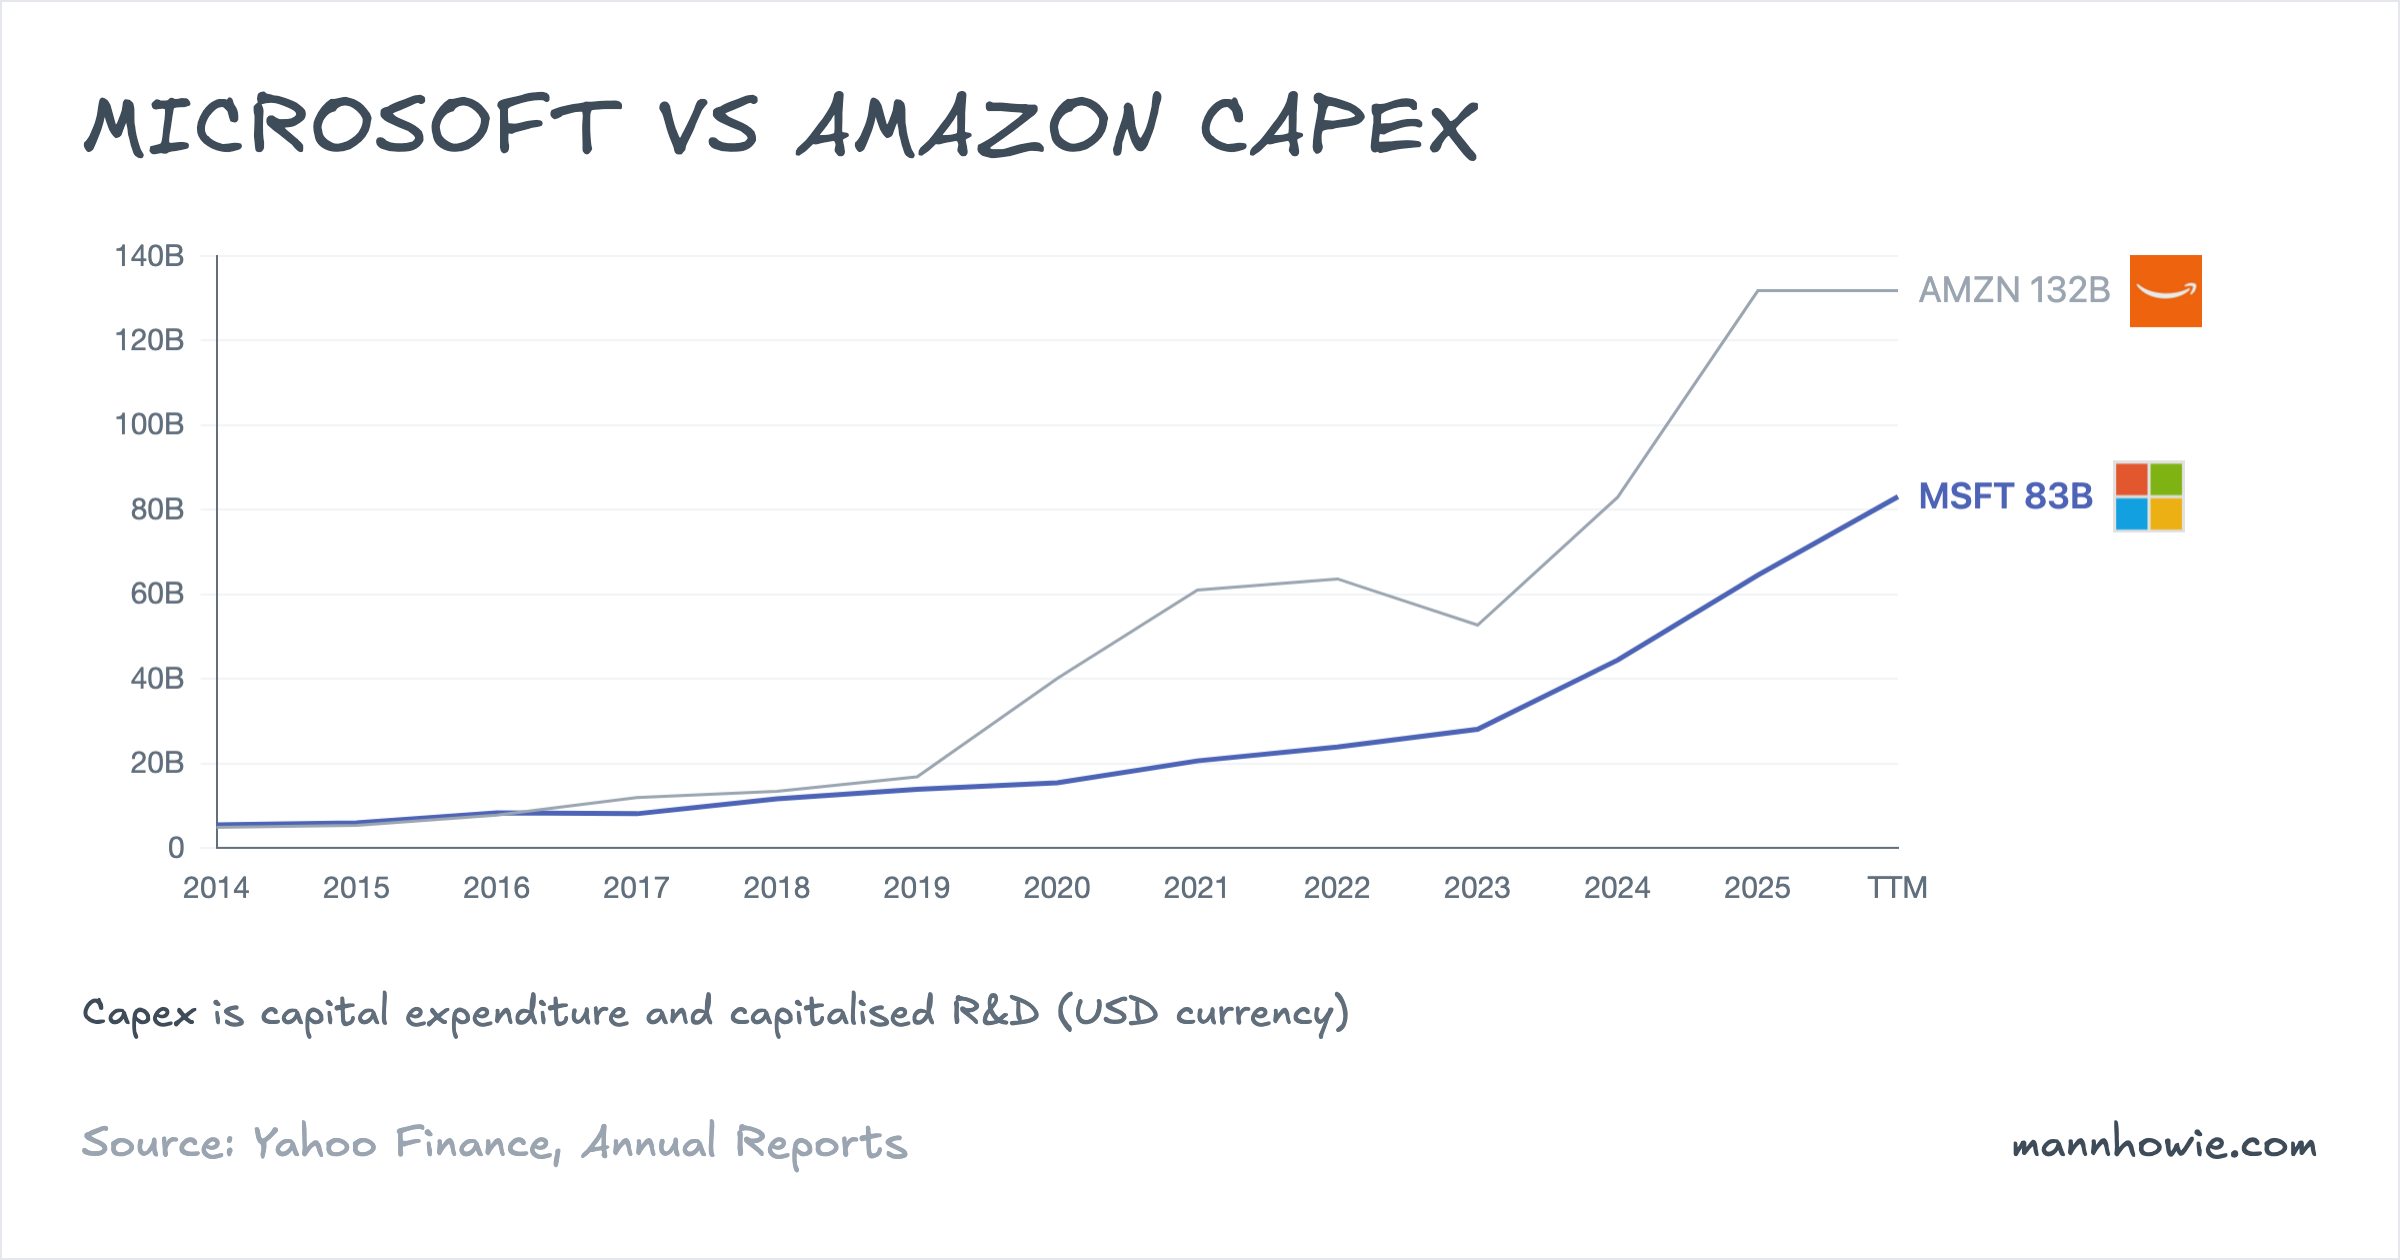
Capital expenditure has risen sharply at both companies, directed at AI infrastructure.
| Capex (USD M) | FY2022 | FY2023 | FY2024 | FY2025 | 3Y Change |
|---|---|---|---|---|---|
| Microsoft | 23,886 | 28,107 | 44,477 | 64,551 | +$41B |
| Amazon | 63,645 | 52,729 | 82,999 | 131,819 | +$68B |
Microsoft’s capex has nearly tripled over three fiscal years. Amazon’s has roughly doubled. Both programmes fund datacentres, AI accelerators, and long-dated power supply contracts.
The divergence shows in free cash flow. Microsoft generated $65B in trailing free cash flow despite $83B in TTM capex, because its $143B of operating profit covers the spend. Amazon’s trailing free cash flow is negative $11.8B on $132B of TTM capex, because $80B of EBIT does not cover the outlay.
“The way AWS’s cash cycle works is that the faster AWS grows, the more short-term capex we’ll spend… We are willing to make large capex investments and endure short-term FCF headwinds for the substantial medium to long-term FCF surplus.”
— Andy Jassy, Amazon 2025 CEO Letter
Microsoft’s FY2025 10-K discloses $32B in construction commitments and $110B in purchase commitments as of June 2025, mostly for datacentre capacity and take-or-pay contracts. Amazon has guided for roughly $200B of capex in 2026, supported by customer commitments including a single OpenAI contract reported at over $100B.
Both companies have developed custom silicon to reduce dependence on Nvidia and lower the cost per inference. Microsoft’s Cobalt CPU and Maia AI accelerator are in production across Azure datacentres. Amazon’s Graviton CPU is used by 98% of the top 1,000 EC2 customers, and its Trainium AI accelerator, now in its third generation, is largely sold out. Amazon’s management has stated that Trainium at scale is expected to save tens of billions of capex dollars per year and deliver several hundred basis points of operating margin advantage over third-party chips.
Sources
- Microsoft 10-K FY2024, pages 92–93 (segment revenue, segment operating income, revenue by product and service).
- Microsoft 10-K FY2025, pages 84–85 (segment revenue, segment operating income, revenue by product and service).
- Amazon 10-K FY2024, pages 65–68 (segment revenue, segment operating income, net sales by product line).
- Amazon 10-K FY2025, pages 67–69 (segment revenue, segment operating income, net sales by product line).
- Satya Nadella, Microsoft 2025 Shareholder Letter, October 15, 2025 (Azure revenue, datacentre capacity).
- Andy Jassy, Amazon 2025 CEO Letter, April 9, 2026 (AWS cash cycle, capex philosophy, Trainium silicon).